There are lots of baseball statistics readily available today. They expand our knowledge of the game. They also help us illustrate what a number means.
Take, for example, Miles Mikolas, the surprising ace of the St. Louis staff this year. He had a 2.83 ERA. We all know that’s a good number. The National League average in 2018 was 4.03. So Mikolas was more than a run better than average. That’s good. Among 72 NL pitchers with at least 100 innings, Mikolas’s 2.83 was eighth. Also good!
But we can also flip around his statistics to see how batters fared against him. Batters against Mikolas hit .245 with a .278 on-base percentage and a .350 slugging percentage. Scanning 2018 batting figures, we see that slick-fielding shortstop Adeiny Hechavarria hit.247 with a .279 on-base percentage and a .345 slugging percentage. That’s really close to Mikolas’ figures. So we can say that in 2018, Miles Mikolas turned opposing batters into Adeiny Hechavarria. I’m sorry to report that Mikolas’ teammate, Luke Weaver (.277/.345/.441 allowed) turned opposing batters into Starling Marté (.277/.327/.460).
I think this sort of comparison, in addition to being fun, adds context. Of course, I didn’t really have to include the comparable batters. You know that Mikolas’ .624 OPS allowed is good, and Weaver’s .786 allowed is not. But it’s evocative to say that Mikolas turns opposing batters into Hechavarria.
I figured, if we can play this game with pitchers, why not hitters? Is there a way to translate hitting statistics into something pitcher-relevant? Of course, there aren’t ERAs for hitters. But are there measures that are close?
I think there are two. One is FIP. Most of you are familiar with FIP. It uses the pitching events over which a pitcher has control—walks, hit batters, strikeouts, and home runs—to synthesize a figure similar to ERA. Another metric is Component ERA (CERA), a statistic invented by Bill James. It takes the baserunners a pitcher allows via hits, walks, and hit batters to synthesize an ERA. FIP strips out balls in play. CERA strips out sequencing. Both can give us insights into a pitcher’s underlying performance that ERA might misrepresent. For example, Blue Jays right-hander Marcus Stroman had a bad ERA this year, 5.54. His FIP (3.94) and CERA (4.59) suggest he was better than his ERA.
FIP and CERA aren’t the only ERA estimators out there. The most prominent of these is our Deserved Run Average, or DRA. DRA, though, is a mixed model, not amenable to a quick spreadsheet calculation. So I’m using FIP and CERA here.
We can apply FIP and ERA to a batter’s statistics to answer the question, “What would a pitcher who faces only Player X do?” The formula for FIP is pretty simple:
(13 x HR + 3 x (BB + HBP) – 2 x K) / IP + FIP constant
The FIP constant varies from year to year. It’s the figure that makes aggregate FIP equal to the MLB average. In 2018 it was 3.161.
CERA is more complicated. It’s a three-step process. The first step is to calculate Pitcher Total Bases (PTB), which is:
0.89 x (1.255 x (H – HR) + 4 x HR) + 0.475 x (BB +HBP – IBB)
The second step creates a preliminary CERA:
9* ((H + BB + HBP) x PTB) / (BFP x IP) – 0.56
The third step is necessary only if the resulting CERA is less than 2.24. Then we use this formula instead:
0.75* 9* ((H + BB + HBP) x PTB) / (BFP x IP)
One problem: FIP and CERA both use innings pitched. There is no column on a batter’s card for innings. But it turns out to be fairly easy to synthesize. Innings for pitchers is simply the number of outs that occur with the pitcher on the mound, divided by three. We can roughly estimate a batter’s outs by subtracting hits from at-bats and adding double plays, sacrifice hits, and sacrifice flies. Yes, I know, errors and outs on the bases and non-groundball double plays and all the other stuff. But it’s close enough. Seriously. Here’s 2018:
(165,432 at bats – 41,021 hits + 3,457 DP + 823 SH + 1,235 SF) / 3 = 43,308 2/3
There were 43,489 innings pitched in MLB. That’s less than half a percent of a difference. Close enough!
Enough words. Time for tables. Here are the 15 hitters who clobbered pitchers for the highest FIP in 2018:
| Batter | Team | FIP |
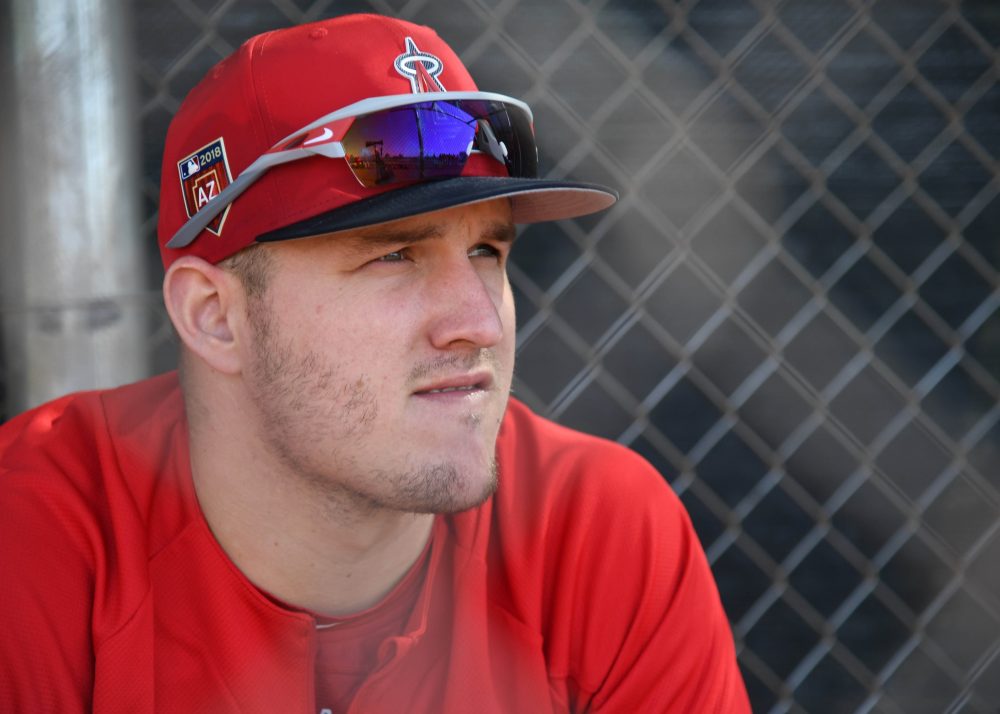
| Mike Trout | Angels | 9.06 |
| José Ramírez | Indians | 7.97 |
| Max Muncy | Dodgers | 7.66 |
| Mookie Betts | Red Sox | 7.46 |
| Alex Bregman | Astros | 6.94 |
| J.D. Martinez | Red Sox | 6.743 |
| Bryce Harper | Nationals | 6.741 |
| Travis Shaw | Brewers | 6.57 |
| Matt Carpenter | Cardinals | 6.54 |
| Aaron Hicks | Yankees | 6.47 |
| Nelson Cruz | Mariners | 6.46 |
| Nolan Arenado | Rockies | 6.43 |
| Juan Soto | Nationals | 6.38 |
| Khris Davis | A’s | 6.36 |
| Francisco Lindor | Indians | 6.31 |
The batters who generated the highest CERA is a bit different, but no surprises:
| Batter | Team | CERA |
| Mike Trout | Angels | 10.99 |
| Mookie Betts | Red Sox | 10.18 |
| J.D. Martinez | Red Sox | 8.63 |
| Christian Yelich | Brewers | 8.38 |
| Max Muncy | Dodgers | 7.92 |
| Juan Soto | Nationals | 7.44 |
| Aaron Judge | Yankees | 7.24 |
| Justin Turner | Dodgers | 7.28 |
| José Ramírez | Indians | 7.13 |
| Paul Goldschmidt | Diamondbacks | 7.11 |
| Alex Bregman | Astros | 7.05 |
| Nolan Arenado | Rockies | 6.79 |
| Bryce Harper | Nationals | 6.69 |
| Ronald Acuña | Braves | 6.65 |
| Anthony Rendon | Nationals | 6.54 |
The sad thing about this list is that it’s not really analogous to what I said earlier about pitchers, simply because there’s no Hechavarria analogue here. No pitcher who puts up a 9.06 or 10.99 ERA, the FIP and CERA of a pitcher who faces nothing but Mike Trout, would stay in the majors. Chris Tillman had a 10.46 ERA in 26 2/3 innings this year. That earned him his release from the worst team in baseball. That’s how every pitcher did against Mike Trout.
Nationals rookie Juan Soto, per CERA, turned every pitcher into Cincinnati’s Brandon Finnegan (7.40 ERA in five starts). FIP contains its enthusiasm a bit, saying Soto turns pitchers into Yovani Gallardo (6.39 ERA in 94 1/3 innings). Makes you wonder what he might do in his twenties.
Of course, not every hitter is good. Per FIP, here are the 10 hitters who made pitchers look the best this season:
| Batter | Team | FIP |
| Austin Jackson | Giants/Mets | 1.54 |
| Orlando Arcia | Brewers | 2.22 |
| Adam Engel | White Sox | 2.25 |
| Michael Taylor | Nationals | 2.48 |
| Jorge Alfaro | Phillies | 2.58 |
| Scott Kingery | Phillies | 2.60 |
| Cory Spangenberg | Padres | 2.61 |
| Billy Hamilton | Reds | 2.62 |
| Rosell Herrera | Reds | 2.65 |
| James McCann | Tigers | 2.78 |
The Phillies were surprisingly good this year, but they did give 861 plate appearances to two batters who turned pitchers into Carl Edwards Jr.
These 10 batters were the easiest on pitchers according to CERA:
| Batter | Team | CERA |
| Chris Davis | Orioles | 1.84 |
| Lewis Brinson | Marlins | 1.86 |
| Chris Owings | Diamondbacks | 2.04 |
| Orlando Arcia | Brewers | 2.09 |
| Alcides Escobar | Royals | 2.24 |
| James McCann | Tigers | 2.33 |
| Jacoby Jones | Tigers | 2.35 |
| Scott Kingery | Phillies | 2.379 |
| Rosell Herrera | Reds | 2.385 |
| Dexter Fowler | Cardinals | 2.44 |
There’s really no need to pile on Chris Davis. So I’ll just mention that Blake Snell had a 1.89 ERA.
I liked working on this article. I think this stuff is fun. I hope you do, too. And if Max Muncy, who turned every pitcher into Brandon Maurer (7.76 ERA in 31 1/3 innings for the Royals), isn’t the biggest surprise of 2018, I don’t know who is.
Thank you for reading
This is a free article. If you enjoyed it, consider subscribing to Baseball Prospectus. Subscriptions support ongoing public baseball research and analysis in an increasingly proprietary environment.
Subscribe now
On the flip side, Michael A. Taylor was pretty bad in the box this year (although I think still better than Billy Hamilton even though their TAv and CERA are comparable...power differential matters in those doldrums), but I don't know about fourth-worst-in-MLB bad.
Looking beyond players I watched just about every day, CERA also appears to more properly value hitters we know, from their highly visible impact and other measures like WAR (for all its flaws), are at the top - such as Betts and Martinez.
Regardless of hitter-FIP or hitter-CERA, though... this really just reinforces how unbelievably good Trout is.