
1. Introduction
The concept of “spin efficiency” was first introduced in an article entitled “All Spin Is Not Alike” written by one of us several years ago, although those words were not actually used. The essential physics that forms the starting point of that article is that the components of spin perpendicular to the direction of motion (the “active spin” ωT) result in movement, whereas the component parallel to the direction of motion (the non-active or “gyro” component ωG) does not. Separation of the total spin ω into active and non-active components requires knowledge of the three-dimensional spin axis. Unfortunately, this quantity is not directly measured by Trackman, which was the pitch-tracking device used by Statcast during the 2015-2019 seasons. Nevertheless, it is still possible to determine the spin axis from Trackman, albeit indirectly and approximately, from an analysis of the measured trajectory and total spin. It was the development of this technique that was the principal focus of that article.
In the article, it was speculated that the ratio ε=ωT/ω might be a useful diagnostic for pitchers as they try to optimize the spin axis to achieve a particular desired effect. Subsequently this ratio was given the name “spin efficiency.” We prefer not to use that nomenclature, since it might mislead people into thinking that a high spin efficiency is always desirable. Subsequent research has shown that that is not necessarily the case. Therefore, we prefer the terminology “active spin ratio” (ASR).
The speculation about the usefulness of ASR has been borne out by the plethora of articles on the subject as well as the concept of utilizing spin axis as one of the metrics for pitch design.
2. Determining Active Spin Ratio from Statcast Data
The technical details for determining the ASR from Statcast data have been described in an unpublished article entitled Determining the 3D Spin Axis from Statcast Data, which includes reference to a spreadsheet template for doing the necessary calculations. The calculations require two distinct inputs. First is the actual trajectory data. For Statcast, those data are in the form of the so-called 9P constant-acceleration parametrization of the pitch trajectory as well as the total spin ω. These data determine the movement, using the technique described in a recent article. Second is a physics-based relationship between movement and active spin ωT. The movement depends on both the air density and the flight distance, the latter depending on the release point. For purposes of the present article, in which we want to compare pitches with different air densities and release points, we define a normalized movement M, which is related to the actual movement M0 by

where D is the flight distance in ft and ρ is the air density in kg/m3. The normalized movement is what the actual movement would have been had the same pitch been thrown at a release point of 55 ft (and therefore D=53.58 ft) and at an air density of 1.195 kg/m3, as appropriate for sea level, with 70° F temperature, 29.92 inches barometric pressure, and 50 percent relative humidity. The equations can then be manipulated to derive a relationship between the normalized movement M and the number of rotations R of the ball, also assumed normalized to a 55 ft release point:
Setting the ASR (ε) to its maximum value of one results in an expression for the upper limit of normalized movement M for a given number of rotations R.
An example is shown in Fig. 1. Each point on the plot is an average of at least 150 pitches thrown by a pitcher/pitch-type combination during the 2019 season and shows the relationship between the movement and rotations.( For the remainder of this article, whenever “movement” is used it is understood to be “normalized
movement.”) The solid curve is the expected upper limit from Eq. 2 with ASR=1; that is, it is the maximum amount of movement for a given number of rotations and somewhat overshoots the upper contour of points. The dashed curve scales the solid curve by a factor of 0.96, a value still consistent with the laboratory data, and is a better upper limit of the actual points. Nearly all the points fall below the dashed curve, indicating ASR<1. If a point on the plot is moved horizontally to the left until it intersects the curve, the ASR is the ratio of the R at the intersection to the actual R. In effect, the ASR can be measured with a ruler! On the other hand, the vertical distance between a point and the curve is a measure of how much additional movement could be achieved with the same spin rate but with a purely transverse spin axis (i.e., with ASR=1).
There are some important caveats that should be mentioned.
- Since the unavoidable random noise in the measurement of the movement propagates to a considerable random noise in the inferred ωT, we will only investigate averages over a sufficiently large sample to reduce the effect of that noise.
- The relationship between movement and active spin, Eq. 2, is based on a “best fit” to the laboratory data. Give the scatter of the data about the fit, that relationship should be considered as only approximate. Indeed, we have already seen that scaling down by a factor of 0.96 is a better upper limit of the Statcast data. Moreover, just as it is now known that there is a significant ball-to-ball variation in the drag coefficient for a baseball, so too might there be such a variation for the lift coefficient. For the remainder of this article, the scaled-down curve will be used to establish the upper limit and to determine the ASR.
- There is a growing body of evidence that mechanisms other than the Magnus force lead to movement on a pitch, particularly forces associated with the flow of air over the seams. Wind can also result in movement; e.g., for a typical fastball a 5-mph cross wind can result in nearly two inches of sideways movement. While one can still use Trackman data to determine the movement on a pitch, it would not be appropriate to interpret that movement in terms of active spin, at least to the extent that these other forces are significant.
- Finally, it is important to realize that the separation of spin into active and gyro components is not constant throughout the trajectory. While the actual spin axis probably remains fairly constant, the direction of the ball does not. For example, a pitch that is released with pure gyrospin (ω=ωG) will eventually have active spin, since as the pitch falls under gravity (as it always does), the spin axis is no longer aligned with the velocity, leading to a small amount of late horizontal break. In our analysis, we determine the total movement and from that derive the active spin ωT and the ASR, both of which should be interpreted as an average over the full trajectory.
As a result of these caveats, the determination of the active spin ratio from analysis of Statcast data should be considered approximate. Despite the approximation, the fact that the calculated upper limit in Fig. 1 is close to the upper limit of the data suggests that there is still some very useful analysis that can be done and meaningful conclusions to be drawn, as we now intend to demonstrate.
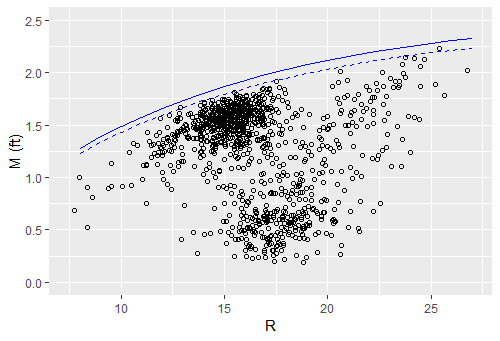
Figure 1. A plot of movement M vs. rotations R for 2019 Statcast data. Each point represents an average over at least 150 pitches for an individual pitcher and pitch type. The movement numbers have been normalized to constant flight distance and air density. The solid curve, calculated using Eq. 2, is the expected M value for unit active spin ratio. The dashed curve is a rescaling of the solid curve by a factor of 0.96 and is a better upper limit to the data.
3. Analysis
With these preliminary comments, we now investigate some interesting features in the data, all of which were downloaded from the official MLB site using the baseballr package. Game-time atmospheric conditions, which are necessary for finding the air density, were scraped from the web.
We start by breaking down the previous chart into those for specific pitch types, as shown in Fig. 2. Generally fastballs (FF, FT, SI) appear in relatively tight clusters with close to the maximum movement, meaning a high ASR. Cutters also appear in a tight cluster, albeit with a significantly smaller ASR. On the other hand, sliders, curveballs, and changeups are considerably more spread out. Splitters show the expected behavior: lower spin rate and less movement. One curious feature in the data is that, for some of the pitch types, higher spin is accompanied by higher ASR, particularly for sliders and curveballs. On the other hand, changeups and splitters seem to follow a contour parallel to the curves, suggesting a constant ASR with increasing spin rate. We have not made any attempt to interpret these features in terms of the biomechanics of pitching, leaving it for future researchers to pursue.

Figure 2. Movement M vs. R for various pitch types, as indicated, including changeup (CH), curveball (CU), cutter (FC), 4-seam fastball (FF), splitter (FC), 2-seam fastball (FT), sinker (SI), and slider (SL). The points highlighted in red have a mean ASR greater than 0.95. The larger green point is league average. The dashed curve is identical to that in Fig. 1.
Table 1 shows the pitchers with highest active spin ratio for several pitch types, along with the league average. Several noteworthy features are worth pointing out.
- Chaz Roe’s slider has ASR=0.98. Such a high value is not normally associated with a slider, as Fig. 2 indicates. Indeed, the next highest value on the leaderboard is Trevor Bauer at 0.68. Roe gets about 25 inches of movement on his slider, 24 inches of which is horizontal movement. So his pitch is released with almost-perfect sidespin.
- Rich Hill’s curveball has ASR=1.15, which of course is not possible and points out the limitations of this analysis. Note, however, that the M-R upper limit curve in Fig. 2 bends over at high spin rate to become more horizontal, meaning that the precision in determining the active spin from the movement gets progressively worse at higher spin rates. Despite these shortcomings, it is remarkable how he has been able to harness his pitch to get the maximum movement from his 2915 rpm of spin rate, 19 inches of glove-side movement and 18 inches of downward movement.
- Trevor Bauer is remarkable for appearing in the top-five for three different pitches: curveball, slider, and changeup. Bauer is one of the early pitchers to speak publicly about his efforts at pitch design. His efforts seem to have paid off.
- Jeff Hoffman pitches for the Colorado Rockies and has a natural disadvantage due to the reduced air density. Although not appearing on the top-five list, his curveball has ASR=0.77, resulting in about 19 inches of unnormalized movement, compared to league average of 17 inches. His relatively large ASR allows his movement to exceed league average, despite the Coors Field disadvantage.
Table 1. Pitchers with the highest mean active spin ratio (ASR) for each pitch type during the 2019 season. Also shown are mean values for the release velocity V, the total spin ω, and the normalized movement M.
| Pitcher | Type | V (mph) | ω (rpm) | M (ft) | ASR |
| Justin Verlander | FF | 94.6 | 2572 | 1.92 | 1.01 |
| Josh Hader | FF | 95.4 | 2141 | 1.73 | 0.99 |
| Gerrit Cole | FF | 97.2 | 2555 | 1.85 | 0.96 |
| Cody Allen | FF | 92.2 | 2459 | 1.85 | 0.95 |
| Marco Estrada | FF | 87.4 | 2283 | 1.84 | 0.95 |
| League Average | FF | 93.4 | 2287 | 1.50 | 0.72 |
| Andrew Kittredge | FT | 94.8 | 2286 | 1.81 | 1.00 |
| Martin Perez | FT | 93.9 | 2053 | 1.71 | 1.00 |
| Luis Castillo | FT | 96.4 | 2073 | 1.69 | 0.99 |
| Ariel Jurado | FT | 92.1 | 1774 | 1.60 | 0.99 |
| Aaron Brooks | FT | 91.9 | 2011 | 1.70 | 0.98 |
| League Average | FT | 92.8 | 2176 | 1.58 | 0.81 |
| Rich Hill | CU | 74.5 | 2915 | 2.23 | 1.15 |
| Taylor Guerrieri | CU | 80.6 | 2998 | 2.14 | 1.03 |
| Adam Wainwright | CU | 74.8 | 2748 | 2.14 | 1.00 |
| Trevor Bauer | CU | 79.2 | 2523 | 2.01 | 0.97 |
| Max Fried | CU | 74.5 | 2841 | 2.13 | 0.95 |
| League Average | CU | 78.9 | 2534 | 1.42 | 0.53 |
| Chaz Roe | SL | 81.0 | 2944 | 2.08 | 0.98 |
| Trevor Bauer | SL | 79.5 | 2736 | 1.77 | 0.68 |
| Adam Ottavino | SL | 81.8 | 2878 | 1.69 | 0.62 |
| Mike Clevinger | SL | 80.7 | 2516 | 1.58 | 0.61 |
| Kyle Crick | SL | 81.6 | 3240 | 1.79 | 0.60 |
| League Average | SL | 84.7 | 2424 | 0.68 | 0.22 |
| Noah Syndergaard | CH | 91.1 | 1695 | 1.56 | 1.01 |
| Mike Minor | CH | 86.2 | 2297 | 1.84 | 0.96 |
| Trevor Bauer | CH | 86.0 | 1703 | 1.56 | 0.95 |
| Chris Sale | CH | 85.3 | 1970 | 1.72 | 0.94 |
| Aaron Sanchez | CH | 87.9 | 1815 | 1.60 | 0.94 |
| League Average | CH | 84.7 | 1806 | 1.40 | 0.74 |

Figure 3. Changes in active spin ratio vs changes in total spin rate, from 2018 to 2019. Five specific pitchers are identified and discussed in the text and Table 2.
Table 2. Pitchers with significant changes from 2018 to 2019.
| Pitcher | Type | 2018 | 2019 | ∆M (inches) | ||||
| ω (rpm) |
ASR | M (ft) |
ω (rpm) |
ASR | M (ft) |
|||
| Shane Bieber | CU | 2001 | 0.71 | 1.53 | 2303 | 0.42 | 1.13 | −4.8 |
| Austin Davis | FF | 2153 | 0.70 | 1.45 | 2430 | 0.83 | 1.71 | +3.1 |
| Homer Bailey | FS | 1263 | 0.92 | 1.25 | 1128 | 0.61 | 0.81 | −5.3 |
| Blake Treinen | SI | 2379 | 0.69 | 1.49 | 2251 | 0.94 | 1.73 | +2.9 |
| Trevor Bauer | SL | 2657 | 0.44 | 1.30 | 2736 | 0.68 | 1.77 | +5.6 |
It is interesting to examine changes in spin rate and ASR between the 2018 and 2019 season, and this is explored in Fig. 3. The vast majority of pitcher-type combinations exhibit only modest changes. However, a number of pitchers made significant changes and some of these were highlighted in Table 2, which we will now discuss.
- Shane Bieber increased the spin rate on his curveball by over 300 rpm. However, his ASR fell significantly from 0.71 to 0.42. The net result was a loss of nearly 5 inches of movement.
- Austin Davis increased both the spin rate and the ASR on his 4-seam fastball, resulting in a net increase of 3 inches of movement.
- Homer Bailey had a modest decrease in the spin rate of his splitter but a significant decrease, from 0.91 to 0.61, in his ASR. The net result was a more than 5 inch decrease in movement. However, one should not interpret this as an undesirable outcome. After all, the goal of a splitter is to reduce the upward movement due to backspin, in order to get more drop. Bailey achieved that goal by reducing his ASR. As we mentioned at the very beginning, the goal of pitch design is to create a pitch to achieve a specific goal, which need not necessarily be a large ASR.
- Blake Treinen had a modest decrease in the spin rate of his sinker but a significant increase in the ASR from 0.69 to 0.94, resulting in an increase in movement by nearly 3 inches. If this increase was in the horizontal direction (i.e., more arm-side movement), as opposed to the vertical direction (more “rise”), then he achieved his goal of getting the ball low in the zone.
- Trevor Bauer had a modest increase in the spin rate of his slider but a significant increase in the ASR from 0.44 to 0.68, resulting in over 5 inches of additional movement.
These examples suggest that, using the latest concepts in pitch design, pitchers can indeed alter their pitches to achieve a particular desired outcome.
4. Summary
In this article, the concepts of active spin and active spin ratio were discussed and it was shown how they can be approximately determined from Statcast data. The concept of normalized movement has been introduced, and a formula was given relating it to the number of rotations made by the ball. Several examples of the usefulness of these concepts were presented.
Charlie Young can be found on Twitter at @youngcharles02
Professor Alan Nathan can be found on Twitter at @pobguy
Thank you for reading
This is a free article. If you enjoyed it, consider subscribing to Baseball Prospectus. Subscriptions support ongoing public baseball research and analysis in an increasingly proprietary environment.
Subscribe now