At the 2019 Saberseminar, Isabelle Pardew presented on how prolonging a plate appearance can affect strategy. Now, that presentation is available in its written form below.
1 Background
——
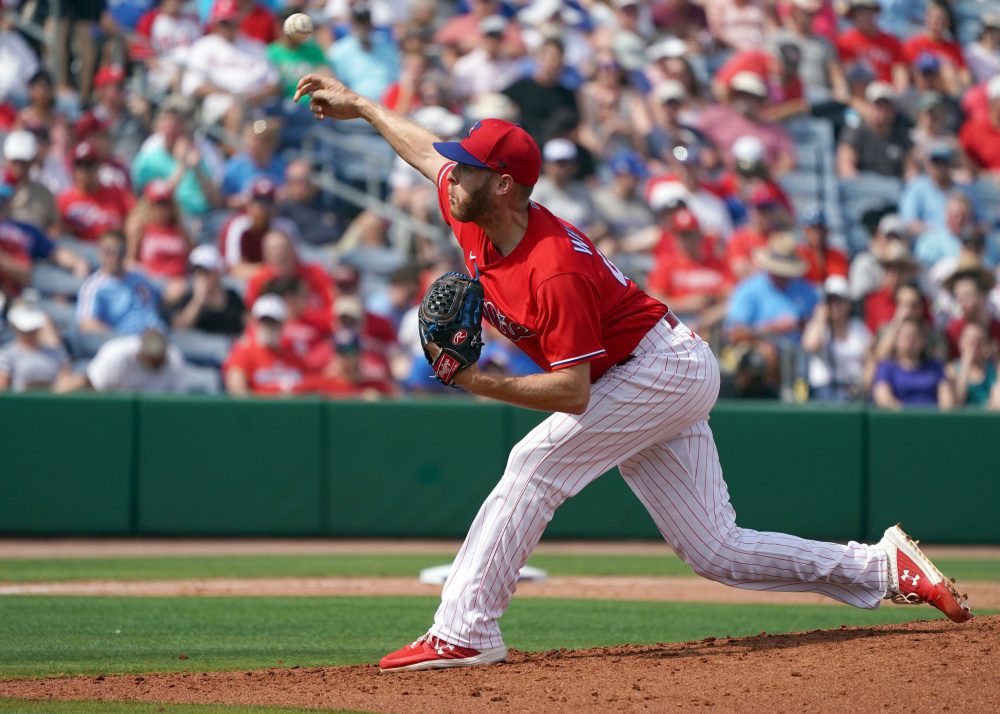
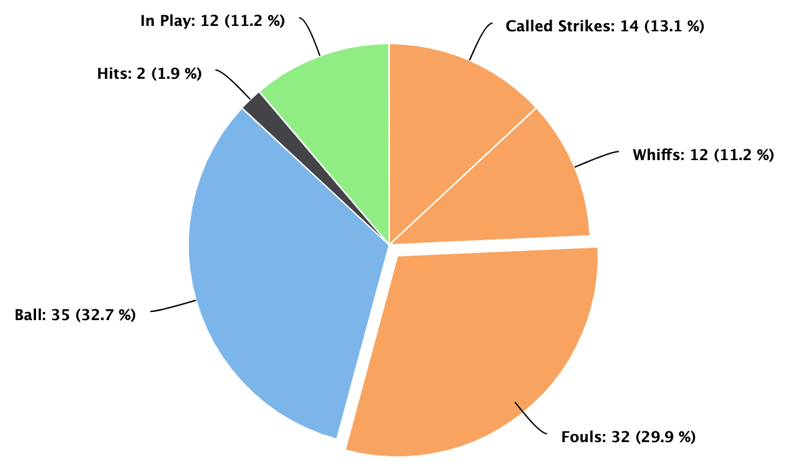
The Mets played the Phillies in Philadelphia on June 27th, 2019 — Zack Wheeler vs. Aaron Nola — in what began as a seemingly routine game. The first inning of work for both pitchers was nothing extraordinary, not allowing any hits or runs. However, things got more interesting in the bottom of the second inning — Jay Bruce came up to bat, and took seven pitches only to ground out to first. Maikel Franco came up two batters later, and remained at the plate for seven pitches, only to pop out to third. It would be tempting to think that so far, we had not seen a lot of action in a still-scoreless game. Now to the bottom of the third, where Andrew Knapp started off with a ten-pitch walk, seeing five of Wheeler’s six pitch types, and Aaron Nola attempted a sac bunt, but actually reached on an error. Wheeler saw three batters over 19 pitches in the rest of the inning—one of those being an eight-pitch strikeout. At this point, it is interesting to note that Zack Wheeler was at 59 pitches through three innings. However, he’d only given up one hit and one walk. This trend continued for six innings of work, with Wheeler ultimately exiting the game early due to a pitch count of 107 (see Figure 1 for the breakdown of pitches).
His stat-line of work was quite respectable: 1 ER, 2 H, 2 BB, 7 K, but there was one slight issue. Wheeler’s exit signaled the entrance of the Mets’ bullpen, which was ranked 30th in the MLB at the time. Ultimately, the Mets lost in the later innings, with Edwin Diaz allowing a 3-1 Mets lead to slip away into a 6-3 Phillies win.
2 Quantify
——
This one game sparked a flurry of questions: how often had we seen a similar situation unfold? Have relievers gotten into trouble with long plate appearances before, and if so, how frequently? Additionally, what was the real detriment for the Mets in this game: the fact that Phillies batters upped Wheeler’s pitch count forcing the Mets to turn to the bullpen earlier, or that the Phillies got more exposure to the Mets pitching strategy and pitch mix?
In order to quantify the effects of such situations, I pursued the following investigative questions:
- How do the plate appearances past two strikes (PA2+) differ for relievers or starters?
- How does a pitcher’s situational rating (SITR) change based on the number of pitches after two strikes?
- Can the effect of racking up a large number of cumulative PA2+ be quantified for starters and/or relievers?
2.1 Technical Details
This section covers the statistical tools I created to use for evaluation of the effect of the plate appearances for various pitchers.
2.1.1 Situational Rating
——
If we seek to analyze the effects of the PA2+, I included several factors that must be taken into consideration: the batter strength, the leverage of the situation (comprised of inning, base-out state, and score differential), and the pitcher and batter rating scores. The situational rating (SITR) score is effectively a basic descriptive statistic that describes what type of situation (PA outcome) a pitcher typically finds themselves in. The weights that determine the severity of the PA outcome are calculated from the average change in win probability for that outcome. Then, it’s a matter of taking the proportion of occurrences for each pitcher, with the SITR score being the result of the linear combination.
2.1.1 Favorable Outcome
——
Additionally, I explored statistics based upon a “favorable” outcome for the pitcher, rather than by event such as hit, out, walk, etc… The favorable outcomes are outlined in Table 1, where I denote this variable as FVO.
| Event | Mean WPA | FVO |
| Caught Stealing | 5.3% | 1 |
| Other Advance | 4.9% | 1 |
| K | 2.9% | 1 |
| Fielder’s Choice | 2.9% | 1 |
| Generic Out | 2.8% | 1 |
| Pickoff | 2.8% | 1 |
| Defensive Indifference | -0.40% | 0 |
| Stolen Base | -2.0% | 0 |
| IBB | -2.3% | 0 |
| Passed Ball | -2.6% | 0 |
| WP | -2.7% | 0 |
| Balk | -2.9% | 0 |
| BB | -3.2% | 0 |
| HBP | -3.4% | 0 |
| Interference | -3.8% | 0 |
| 1B | -4.5% | 0 |
| Error | -4.8% | 0 |
| 2B | -7.3% | 0 |
| 3B | -10.0% | 0 |
| HR | -13.2% | 0 |
Table 1: FVO Label
Just how is each FVO score determined? I calculated the Win Probability Added (WPA) for the league on each event, where FVO = 0 if pitcher WPA < 0, and if pitcher FVO = 1 if pitcher WPA > 0. To assure that game tendencies were captured, I initially computed the mean WPA for starters and relievers separately. However, the values were nearly identical, so the distinction does not make a noticeable difference.
2.2 Relievers vs Starters
——
When facing batters not in the top 25% of WAR, relievers seem to have more efficacy when they are required to quickly close out an at-bat, as shown in Figure 2. That is, the tendency to have a higher probability of an FVO given the number of pitches after two strikes is small. Starters tend to perform slightly better than relievers when the at bats start getting longer. This reinforces the hypothesis that the starters will typically win the PA2+, and the relievers will tend to lose them. Figure 2 analyzes the empirical probability of a favorable outcome given the number of pitches after two strikes.
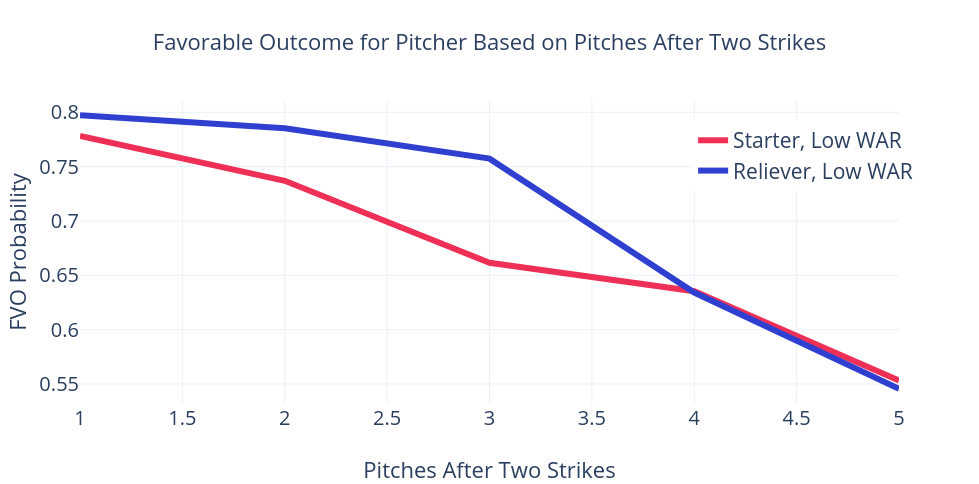
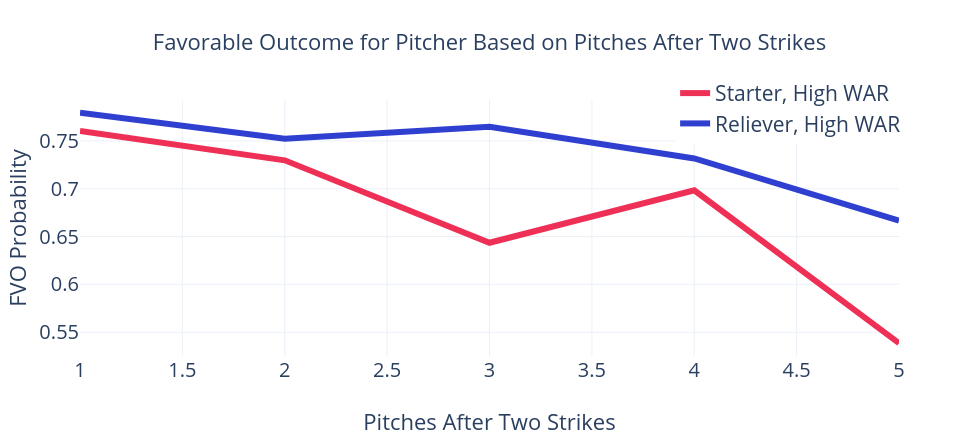
Figure 2: Outcome with Lower Quantile Batters (left) vs Upper Quantile Batters (right)
Now, I look at the same graphic for plate appearances with batters in the top 25% of league WAR values—for that particular season. The starters have a harder time finishing a PA2+ perhaps due to a skilled batter who has seen many of their pitches. Next, I analyzed how the strikeout percentage changes relative to the number of PA2+ in a game, illustrated in Figure 3.
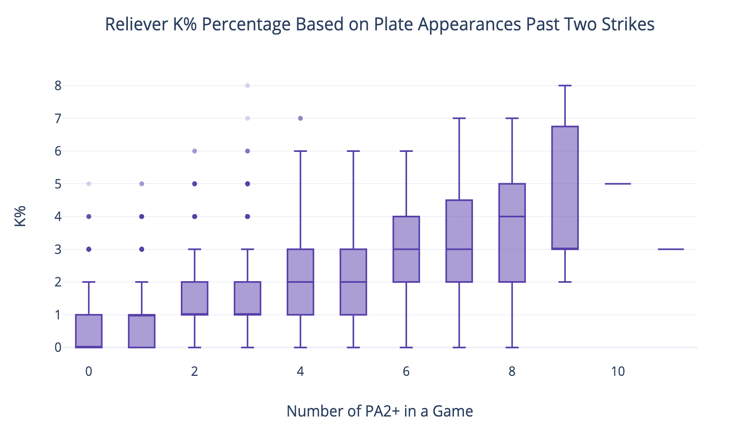

Figure 3: K% for Relievers (left) vs Starters (right)
As the number of PA2+ increases, relievers see a relatively fast increase in the mean strikeout percentage. If analyzing starters, there is a more gradual increase in the strikeout percentage, but the trend is similar — as a starting or relief pitcher is staying in long plate appearances more frequently, they are better able to get a strikeout. It is noted that this could also be due to a higher frequency of two strike counts, thus a higher opportunity of getting a strikeout.
2.3 SITR Performance
——
Over the course of a game, the manner in which pitchers are acquiring their outs becomes clearer. Some rely on the two-strike count, and go for the strikeout, while others go for the chance that the batter won’t make direct contact, thus getting a ground ball out or a similar out type. I thus analyzed the difference between pitchers that perform better when not reaching two strikes at all versus getting deep into counts. Several tendencies are observed with pitchers:
- Ineffective performance when not reaching two strikes, and performing better when getting deeper into the count
- Effective performance when not reaching two strikes, and starting to decline when the appearance is prolonged
To illustrate the difference, I selected two relievers and two starters that perform quite differently based on the length of the plate appearance. I used the pitcher rating (in terms of WPA) as my indicative statistic, separating it into bins for easier interpretability.
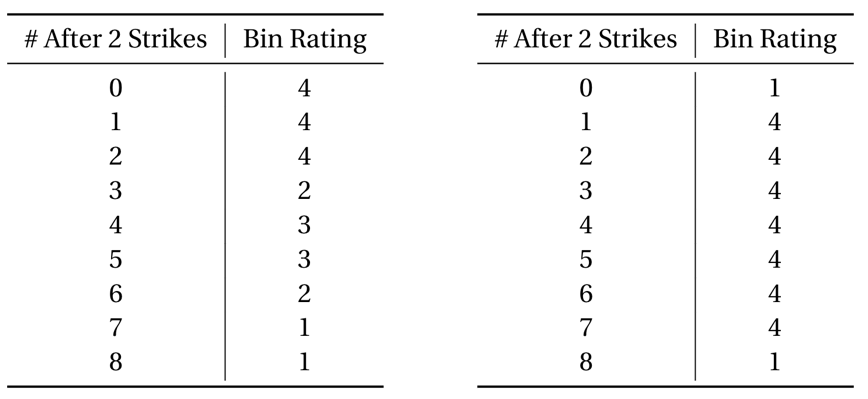
Figure 4: Wade Davis (left) vs Dellin Betances (right)
Note: small sample sizes are expected in the longer plate appearances.
According to Figure 4, Wade Davis starts out very strong with 0, 1, or 2 strikes, but encounters more negative WPA situations as the plate appearance continues. Dellin Betances performs poorly relative to other relief pitchers when never reaching two strikes, or when the appearance extends for a long time. Could strategy and decision-making tactics for these pitchers be changed based upon these patterns? For example, it would be worthwhile to investigate if these pitchers’ sequencing does indeed change according to these patterns. While Davis would be working to end the plate appearance early, Betances should actually prefer to get to that two-strike threshold and finish the plate appearance there.
Now, I analyze the tendencies for starters in Figure 5.
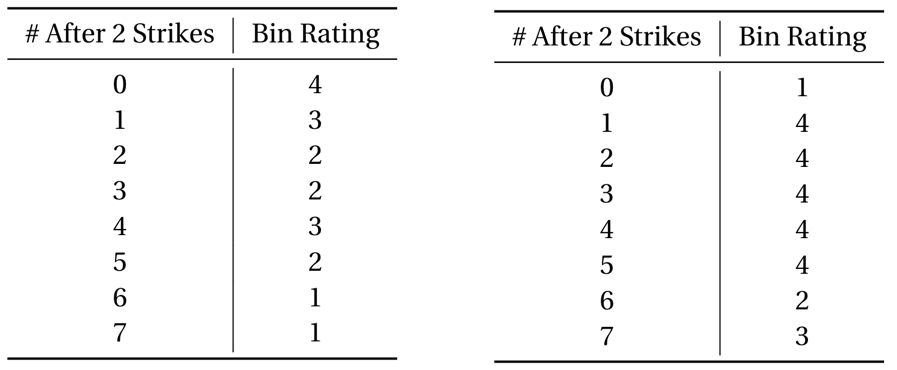
Figure 5: Seth Lugo (left) vs Chris Sale (right)
In analyzing two starters with opposite trends, one can see similar differences in performance, as with the relievers. In reference to Chris Sale, he appears to benefit from working into a plate appearance, whereas Seth Lugo has more negative WPA outcomes than positive as the number of pitches past two strikes increases. In further research, it would be interesting to see if the pitch mix percentage changes significantly from 0 pitches after two strikes to 1 pitch for starting pitchers such as Lugo and Sale. Looking at the pitch-by-pitch level, Chris Sale has a difference in the chase percentage before and after the two-strike threshold, especially when compared to the league average.
If pitchers do well when they don’t reach two strikes, that could further indicate that they are primarily a ground ball or fly ball pitcher, and are well-versed in inducing weak contact rather than complete whiffs or takes.
2.4 Cumulative Effect
——
Isolating a particular PA2+ may or may not provide much insight as to how the game will change. Some PA2+ are identified as a turning point of the game, while others are not. Thus, in the case where one single PA2+ doesn’t change the course of the game, I analyzed the cumulative effect of these plate appearances, as shown in Figure 6.
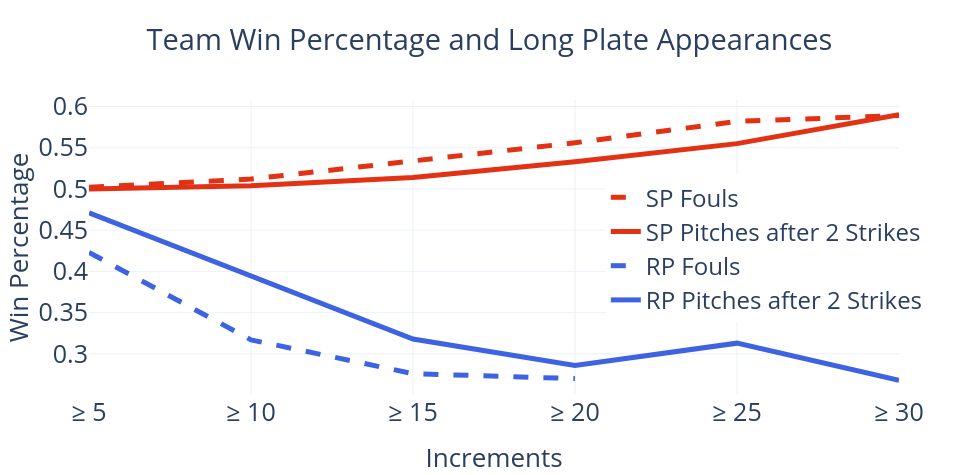
Figure 6: Team Win Percentage Based on Cumulative Pitches After 2 Strikes
A significant difference can be observed that once again distinguishes starters from relievers. For starters, the team win probability starts at 0.500 and begins to slightly increase with the number of fouls/pitches after two strikes. When they encounter more fouls, the team win percentage is a bit higher, possibly due to the fact that fouls can also occur before the two-strike count.
The relievers’ teams are already starting out below 0.500 with five or more pitches after two strikes, dipping to 0.400 if only looking at fouls. The fouls seem to significantly affect the reliever more, perhaps due to their reliance on their primary pitch with a weaker secondary pitch.
It is worth noting that further research could be done to attempt to separate this phenomenon from pitch count, if possible. This would clarify the precise effect that the two-strike threshold has on the pitcher aside from upping their pitch count.
2.5 Alternative Method
——
One of the methods I chose to investigate — unsuccessfully — was the correlation between the number of pitches after two strikes and the outcome of the play by modeling. For example, given identical plate appearances and prior game information up until that point, such as pitch count and times through the order, would one be able to approximate the probability of a “favorable” plate appearance outcome?
After running calculations and fitting several models, I found that the information collected before and after a two-strike count is barely correlated with an FVO. The testing error rates were very high, which indicates that the predictors are not giving sufficient information to predict the response variable. Then I computed the correlation matrix between FVO and the same predictors, where the highest correlation coefficient was for the number of fouls or strikes that occur after two strikes, at 0.166. This would indicate that this information should be considered more of a statistic that will eventually mean something collectively rather than in a predictive nature. That is, as a pitcher accumulates these PA2+, I would expect there to be a more significant correlation with their performance. At a descriptive level, the information before and after the two-strike threshold is extremely informative. However, the predictive work needs to be re-examined more closely — a model built off of pitch-by-pitch information would be more statistically significant.
3 Future Work
——
Continuing this research, I would include the pitcher-batter matchup score (research still currently in progress) to more accurately represent the nature of the matchup in addition to batter WAR and leverage. Additionally, an all-encompassing statistic, which includes Pitcher Score, Batter Score, and Leverage Score, is necessary as well.
As mentioned earlier, working directly with the pitch-by-pitch information may provide more insight into the relationship between these PA2+ and the PA outcome. I aim to find a way to determine the relative “weight”, or importance of each pitch, where ideally it confirms that pitches thrown with two strikes create definitive tension for the pitcher.
4 References
——
Abriano, D. (2019, June 27). Mets Takeaways from Thursday’s soul-crushing loss to Phillies, including an Edwin Diaz meltdown. Retrieved from https://www.sny.tv/mets/news/mets-takeaways-from-thursdays-soul-crushing-loss-to-phillies-including-an-edwin-diaz-meltdown/308544894.
Albert, J. (2019, February 18). Leverage of Win Probabilities. Retrieved from https://baseballwithr.wordpress.com/2019/02/18/leverage-of-win-probabilities/.
Chamberlain, A. (2019, June 22). Are Foul Balls Good or Bad? Retrieved from https://fantasy.fangraphs.com/are-foul-balls-good-or-bad/.
Dokken, N. (2019, January 29). Sabermetric Series, Part 3: Plate Discipline. Retrieved from https://www.fantraxhq.com/sabermetric-series-part-3-plate-discipline/.
Sawchik, T. (2019, February 21). Foul Balls Are The Pace-Of-Play Problem Nobody’s Talking About. Retrieved from https://fivethirtyeight.com/features/foul-balls-are-the-pace-of-play-problem-nobodys-talking-about/.
Sievert, C. (2014, April 13). Modifying and Querying a PITCHf/x database with dplyr. Retrieved from https://baseballwithr.wordpress.com/2014/04/13/modifying-and-querying-a-pitchfx-database-with-dplyr/.
Thank you for reading
This is a free article. If you enjoyed it, consider subscribing to Baseball Prospectus. Subscriptions support ongoing public baseball research and analysis in an increasingly proprietary environment.
Subscribe now