
From our Little League days to time spent in college dugouts as coaches and student managers, even through Sunday adult baseball, we’ve heard the following statement:
“This pitcher coming into the game is going to look a lot faster because of how slow the last guy was throwing.”
If that statement is true, it means that one plate appearance can affect another plate appearance, even if 20, 30, 40 minutes of time (or more?) elapse between trips to the plate for a given hitter.
This means that we still have to think about how to get several hitters out in a row, several times per game. However, it might also mean that we have to reconsider how to construct our bullpens in order to respond to each individual batter’s tendencies throughout a game, not just on a season-long level or career-long basis. Or, to borrow a baseball industry friend’s question, “How much bullpen diversity do we need during a game, season, or series?”
With these questions in mind, we built and refined our dataset, intent on examining the impact of pitching changes, one plate appearance to the next. In this phase of our research, culminating in a presentation at Saber Seminar on August 11th, we focused specifically on the effects of changing pitcher height, handedness, and arm slots from one at-bat to the next within a game.
For example: How does changing from a right-handed, tall, sidearm pitcher to a left-handed, shorter, low-three-quarters pitcher affect batter performance? Realizing that left-handed/right-handed splits often show large differences, we wanted to know if further granularity would produce additional insights about deploying pitchers, or even hitters.
We examined league-wide performance when facing different looks, and highlighted some of the best back-to-back (to-back, if there are any Tom Emanski fans out there!) combinations among specific pitchers, where we found some unexpected, underrated pairings. We based our designations on non-stars that produced xwOBA, whiff rate or exit velo above group mean.
OUR PROCESS:
We originally gathered Statcast data, and cleaned it for optimal clustering. Further, we eliminated pitching outings by position players and pitchers’ plate appearances.
Our cluster attempts that included pitch characteristics and repertoires resulted in irrelevant groupings of non-similar pitchers; A couple of examples:
- The trio of Stephen Strasburg, Marco Estrada and Mike Fiers were one example of dissimilar entities grouped together.
- Baseball’s unicorns, Andrew Miller and Chris Sale, the only two left-handers in baseball that stand at least 6-5, reach certain velocities and throw sidearm were consistently grouped into a two-man cluster.
In the end, we simplified it, and decided to bin pitchers by handedness, height, and arm slots. The effects of contrasting pitch characteristics among various relief pitching combinations will be explored in another article.
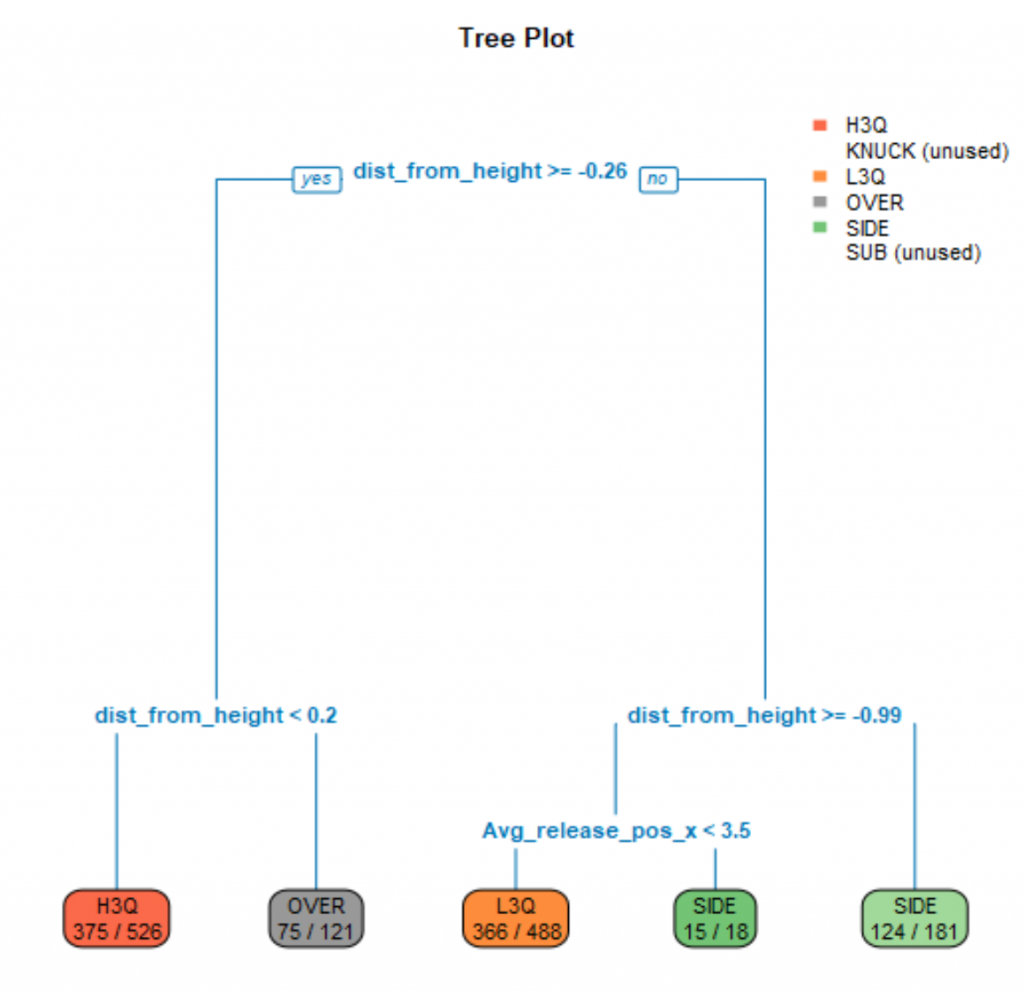
DECISION TREES: ARM SLOTS
After discussing deliveries and arm slots with several industry friends, we settled on five arm slots, opting to split “Three Quarters” into two slots (Hi/Low) rather than three(Low/Mid/High). Several factors went into this choice:
- the wide range of release points and arm circles among pitchers
- adjustments made in-game and in-season by individual pitchers
- variability in Statcast camera setup in stadiums around Major League Baseball
- differences in video camera angles at various stadiums around Major League Baseball
Here are the arm slots we used:
- Submarine
- Sidearm
- Low-Three-Quarters
- High-Three-Quarters
- Overhand
To provide some additional context, here is how we grouped pitchers by height:

SOLVING THE CLASSIFICATION PROBLEM:
To train our data for ultimate classification of arm slots, we watched video on hundreds of pitchers that threw 150 pitches or more in any given season from the beginning of the Statcast era (starting in the 2015 season) through the 2019 All-Star break. Our training data matched 78 percent of the test set. Good, but not great.
While overhand pitchers like Josh Collmenter, submariners (Brad Ziegler) and sidearmers (Steve Cishek) were easy to classify by video, and by x and z release points, there was some debate about pitchers in the high- and low-three-quarters slots.
Using only x and z release statistics from Statcast, combined with HZDIFF (Difference between pitcher height and vertical release ) created a relatively solid classification rate, but there was difficulty in classifying some pitchers. With 22 percent of pitchers still identified incorrectly by our model, we needed to come up with another factor to improve classification.
The misclassified pitchers typically finished their deliveries very low to the ground, which typically correlated with high levels of extension. This indicated a potential trend of z release points that were lower to the ground than other pitchers in a given arm slot. With this in mind, we added extension onto our decision trees model, and returned a classification rate of over 90 percent.
In the end, prior to digging deep into our research, we produced a fully classified “arm slot database” and were ready for research. Here are some cool and relevant stats:
- 239,245 plate appearances and 908 possible permutations of Hand-Height-Arm Slot in our Reliever Sequence Database (which is what we are calling the document). These are all plate appearances where a batter faces a different pitcher than his previous at-bat.
- Just 122 of those combinations have a PA sample size of 500+ since the beginning of the Statcast era, or 100-or-less per season.
- 217 permutations were at 250+ PA or less (n<=50, AVG, per season)
- There were 42,183 total PA among the 691 combinations of under 250+ PA.
- Most batters will rarely see a specific pitcher type (Tall, left-handed, sidearmer) more than 8-12 times in a given year, making it difficult to procure insights for individual batters on a three-factor level.
However, all was not lost, and there were meaningful insights for gleaning. Despite small sample sizes for individual pitchers and hitters on a yearly basis, there were some highly correlative statistics, year over year, and by individual players throughout the five seasons studied.
Please note: We classified each pitcher’s arm slot on a yearly basis, leading to some differences between seasons. We also recognize that some pitchers change arm slots for different pitches. In those cases, we based our designations on season-long averages.
A FIRST LOOK AT RELIEF PITCHER SEQUENCES
Here are a few charts to get started, beginning with batter performance when facing pitchers in different height classes. Red values represent some of the lower numbers in each row, while green highlights higher values.
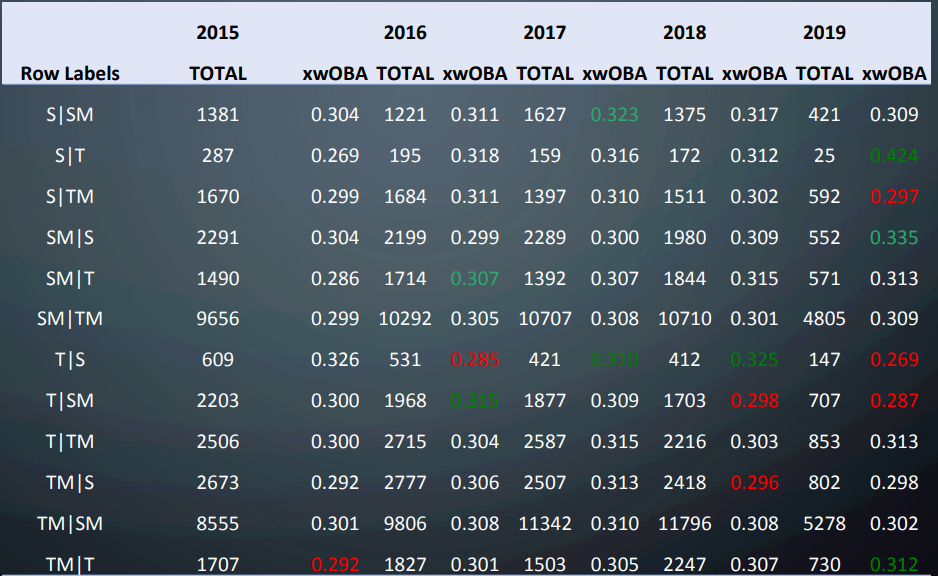
We can see that there are several height class changes where overall xwOBA rates have shown little variation over the five seasons we studied:
| HEIGHT CLASS CHANGE | MIN xwOBA | MAX xwOBA | Range(xwOBA points)
|
| S/SM | .304 | .323 | 19 points |
| S/TM | .297 | .311 | 14 points |
| SM/TM | .299 | .309 | 10 points |
| T/TM | .300 | .315 | 15 points |
| TM/S | .292 | .313 | 21 points |
| TM/SM | .301 | .310 | 9 points |
| TM/T | .292 | .312 | 20 points |
I found this portion of the research interesting, because these height changes are among the most frequent of all possible combinations. SM/TM relief sequences occur over 10,000 times per season, and TM/SM have exceeded 11,000 interactions in both 2017 and 2018, while remaining on pace to reach that number again in 2019 through the All-Star break. Yet, despite the current offensive explosion, the xwOBA allowed held relatively steady over the last half decade.
On the other hand, there were other combinations of pitcher height class changes that were more volatile:
| HEIGHT CLASS CHANGE | MIN xwOBA | MAX xwOBA | Range(xwOBA points)
|
| SM/S | .299 | .335 | 36 |
| SM/T | .286 | .315 | 29 |
| T/S | .269 | .325 | 56 |
| T/SM | .287 | .315 | 28 |
| S/T | .269 | .318 | 49 |
The T/S changes exhibit smaller sample sizes than most, but still average more than 400 total matchups each year. Note that there were just 25 matchups pre-2019 All-Star break in the S/T category.
We might actually put the S/T in the “steady” category, having an overall xwOBA range of 6 points between 2016 and 2018 (.312, .318) after a .269 mark in 2015.
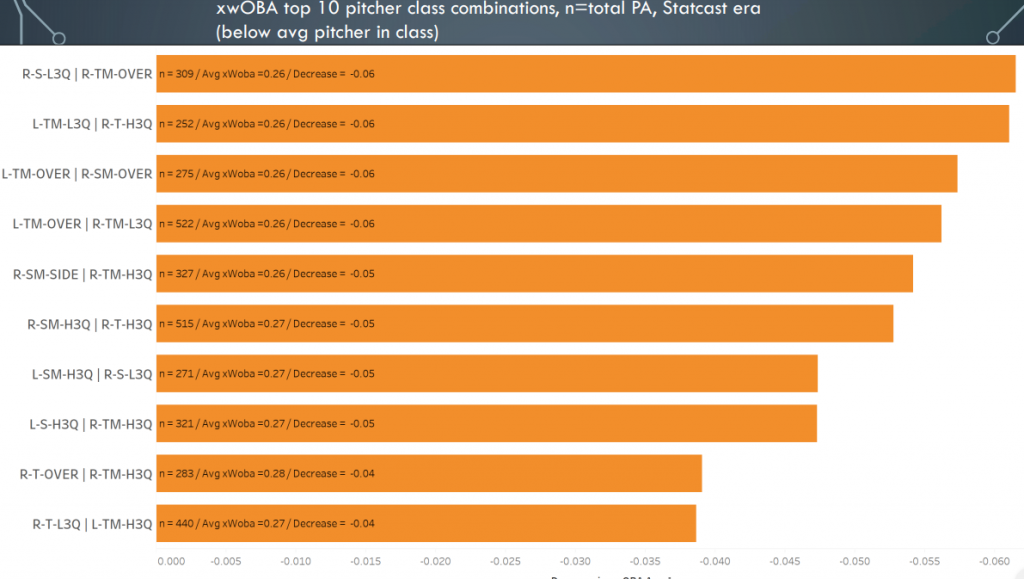
Here’s another point of interest: the top 10 “effect” combinations by pitcher handedness, height and arm slot during the StatCast era. Note that the “Decrease” is overall xwOBA in comparison to the average pitcher in a given classification. The chart is to illustrate some possible matchup insights into choosing one pitcher after another.
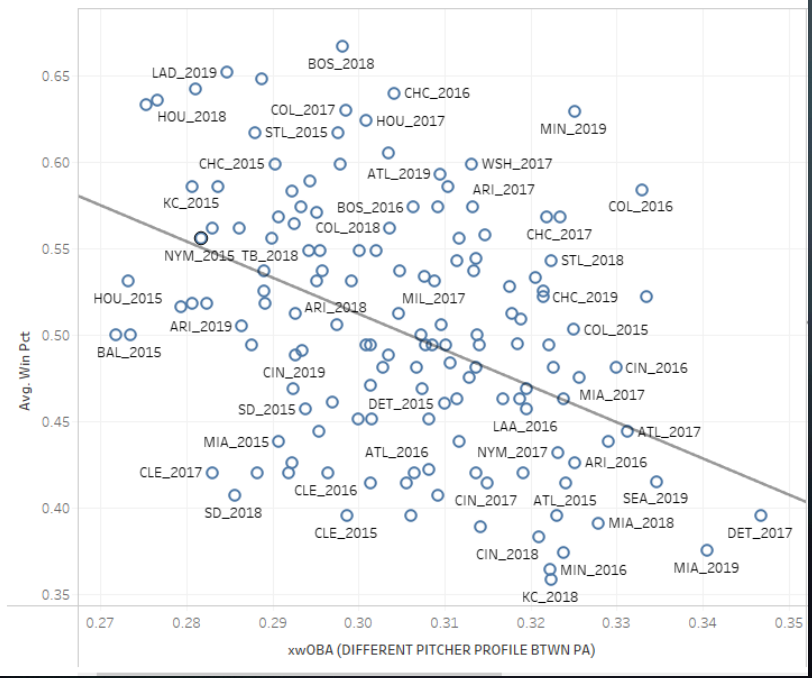
Here’s, a simple scatter plot showing a strong correlation between xwOBA in pitcher profile changes and overall winning percentage. We can see that there are high-powered teams at both ends of the xwOBA spectrum here, ranging from 2015 division champions in Houston and Baltmore at low xwOBA marks, over to the surprising 2019 Twins on the higher xwOBA end.
To close this portion out, here are a couple of things to think about, based upon these two simple scatterplot charts. They show a mediocre, at-best, correlation between winning percentage and whiff rate and chase rate in different relief sequences.

The next part of this project, shown in our upcoming articles, will look into what trends correlate strongly with team performance, as well as focus on individual success and failure rates among players on both sides of the ball. We’ll also highlight different players who show strong ability to make in-game adjustments, and provide some insights on how teams have successfully utilized and mixed height, handedness and arm-slot differences.
Thanks for reading!
Author: Josh Flowerman, with research assistance from Matt Mulhern
To contact the author with any questions, please send email to: joshua.flowerman@gmail.com
Thank you for reading
This is a free article. If you enjoyed it, consider subscribing to Baseball Prospectus. Subscriptions support ongoing public baseball research and analysis in an increasingly proprietary environment.
Subscribe now