This article is part of the launch for Baseball Prospectus’ new hitting statistic, Deserved Runs Created, which you can learn much more about here.

Over the summer, I wrote a pair of articles comparing the three leading modern batting metrics: Baseball-Reference’s OPS+, FanGraphs’ wRC+, and our TAv. If you didn’t read them and don’t feel like clicking on the links, the conclusion was that they’re pretty similar, but there are differences among them.
Now that we’ve released our next-generation offensive metric, Deserved Runs Created (DRC+), I thought it would be appropriate to dust off the analysis. How does DRC+ compare to OPS+ and wRC+?
Before I get started, I intend this to be an analysis of the (small, it turns out) differences between DRC+ and the other two measures. If you interpret it as a criticism of OPS+ or wRC+, it’s because I’m not expressing myself well. Baseball-Reference and FanGraphs are great sites doing great work. I’m just trying to explain how our hitting metrics vary.
As I did earlier, I looked at how batting title qualifiers compared during the 30-team era, 1998 to today. I’m going to show you scatterplots. In each, the first metric mentioned is on the x-axis, the second on the y-axis. And for each, I put the correlation coefficient in the title. Quick math refresher: The closer the correlation is to 1.000, the stronger the relationship between the two numbers.
Let’s start with OPS+ and wRC+.
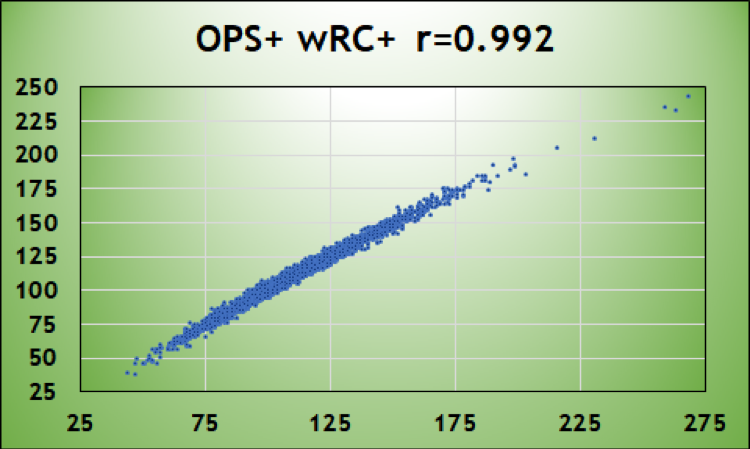
A correlation coefficient of 0.992 is, as you could tell, very, very close to 1.000. OPS+ and wRC+ are almost perfectly correlated. This is interesting, since they don’t really measure the same thing. Baseball-Reference’s OPS+ is park- and season-adjusted OPS. FanGraphs’ wRC+ weights singles, doubles, triples, home runs, unintentional walks, and hit by pitches separately. Yet the end result is almost identical.
Let’s move on the DRC+. Here, it’s compared to OPS+.

OK, 0.935 is less than 0.992, but that is still a really high correlation. This is not a radical departure. Nor is the relationship between DRC+ and wRC+.

Bill James once said, roughly (I can’t find the exact quote), that a new statistic should largely confirm what we already know while imparting some new knowledge. Correlation coefficients that are high, but not too high, are indicative of this.
So let’s drill down on the new statistic. What are the outliers, and what can we learn from them?
Here’s the scatterplot of DRC+ and OPS+ again, but this time with a couple outliers highlighted.

The yellow dot is Aramis Ramírez. In 2010, he batted .241/.294/.452 for the Cubs in 507 plate appearances. OPS+ viewed it as a subpar year, assigning him a 95 OPS+. DRC+ was much more impressed, giving him a 122. What’s the reason for the discrepancy?
In 2010, while Wrigley Field generally helped right-handed batters like Ramírez, DRC+ estimates that he deserved 12 more singles and 10 more doubles than he had. And that’s borne out by his BABIP. In 2007-2009, Ramírez had BABIPs of .313, .303, and .331. In 2011-2013, it was .308, .310, and .308. In 2010: .245. Ramírez had lousy luck in 2010. DRC+ recognizes that and adjusts his score up.
The red dot is Brandon Nimmo, this past season. He was, by OPS, the Mets’ best hitter: .263/.404/.483. That gave him a 150 OPS+. DRC+ likes his season too, but with less ardor: His DRC+ was 119.
One reason is park adjustments. Baseball-Reference views 2018 Citi Field as deadly for hitters: A 90 Park Factor for the season, i.e., it suppressed scoring by 10 percent. That’s a lot; it means Nimmo had to overcome a substantial headwind to generate his .886 OPS. DRC+ doesn’t view Citi Field as harshly as OPS+.
In addition, Nimmo had 28 doubles and eight triples. That’s an impressive 8.3 percent of his at-bats compared to a league average of 5.4 percent. But Nimmo hit only a slightly above-average number of batted balls into the outfield, and he faced pitchers who generated a greater-than-average proportion of ground balls. You usually don’t get a lot of extra-base hits that way, so DRC+ is suspicious. A BABIP of .351 reinforces DRC+’s view that Nimmo’s numbers reflect some good fortune, marking him down.
How about a comparison to wRC+?
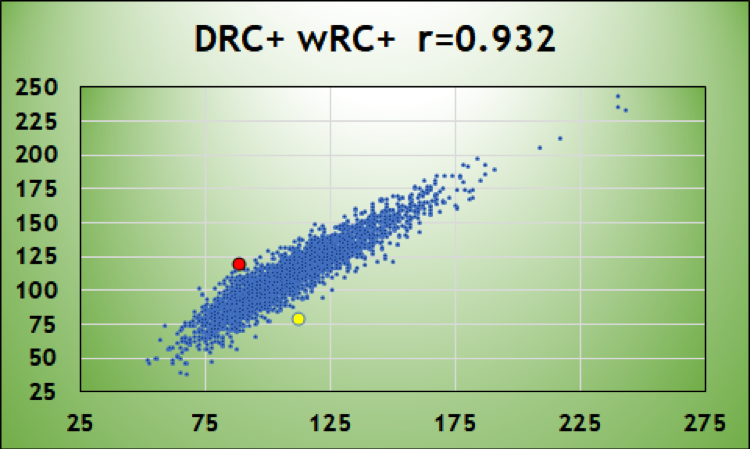
The yellow dot is Vinny Castilla in 1999. He hit .275/.331/.478. This was pre-humidor Coors Field, so it’s relevant to note that he hit .280/.340/.511 at home and .269/.321/.445 on the road. It’s also relevant to note that the National League hit .268/.342/.429 that season, so Castilla’s road OPS of .766 was a shade below the league average of .771. His DRC+ is 113 compared to a wRC+ of 78. The gap of 35 points is the largest, positive or negative, OPS+ or wRC+, compared to DRC+ in the 21 years depicted here.
As you may know, wRC+ has a dim view of Rockies batters. In the team’s 26 seasons, its highest wRC+ for position players is 104, in 2014, and the team wRC+ has hit triple digits only three six times. In other words,per wRC+, Colorado has had a below-average offense in over three quarters of its seasons. As you might imagine, this is in part due to a very large park adjustment that pulls down Rockies hitters’ numbers.
As noted, Castilla was a shade below league average on the road in 1999. His home OPS of .852 is lower than the team average of .932—the Rockies batted .325/.383/.549 at Coors Field that year, sort of an entire team of 2018 Justin Turner—but obviously well above the league average. So wRC+ gives him huge demerits for his run-inflating home park. DRC+, by contrast, sees his home performance as consistent with taking advantage of his surroundings while also being buoyed by them. By wRC+, he was the 13th-worst hitter among 157 batting title qualifiers in 1999. By DRC+, he was the 66th-best, a player whose singles and doubles were suppressed relative to what he deserved.
The red dot is Florida’s Luis Castillo in 2000. He finished fifth in the league in batting that year, hitting .334, and was eighth in on-base percentage, .418. But he had the 13th-lowest slugging percentage, .388, among 73 qualifiers, and, by a wide margin, the lowest isolated power, .054. (Next lowest was Pittsburgh’s Warren Morris, .083.)
His on-base skills—158 singles, 78 walks in 626 plate appearances—gave him a 119 wRC+. His lack of pop—22 extra-base hits—gave him an 89 DRC+. And you can probably guess why. When you’re hitting a lot of singles, you’re benefiting from what Crash Davis described as “one extra flare, one ground ball with eyes, a dying quail.” There’s an element of luck involved in getting singles. DRC+ credits him with 120 deserved singles, well below his actual count of 158. That drops his deserved batting average down to .272 and his deserved on-base percentage to .369. Those adjustments are the difference between a singles hitter being 19 percent above average and 11 percent below.
In general, DRC+ will agree with OPS+ and wRC+. When it doesn’t, it’s going to be because DRC+ looks at what the batter deserved to have produced, not what he did produce. It takes a gimlet-eyed view of park factors, distribution of base hits, and, when warranted, the role of framing on balls and strikes.
This discussion encompasses the 3,192 batters over the past 21 seasons who were batting title qualifiers. For those who fall below the 502 plate appearance threshold, there are larger differences. Here are two examples:
- 1957 Bob Hazle: .403/.477/.649 in 155 plate appearances. 209 OPS+, 207 wRC+, 142 DRC+
- 1969 Joe Rudi: .189/.220/.279 in 129 plate appearances. 42 OPS+, 39 wRC+, 68 DRC+
The 26-year-old Hazle earned his “Hurricane” nickname by pounding the ball after being called up at the end of July, helping the Braves win only their second pennant since 1914. He would appear in just 63 more games in the majors. Rudi was 22 in 1969, and while he was bad in short stints in 1967 and 1968 as well, he’d go on to collect MVP votes in four seasons as one of the top performers for the early 1970s A’s dynasty.
As you can see, DRC+ liked Hazle a lot less, and Rudi a lot more, than the other metrics. The key, I think, is what the metrics are trying to accomplish. OPS+ and wRC+ are telling us what happened. In 1957, Hazle was phenomenal. In 1969, Rudi stunk. DRC+ is telling us what the player’s most likely contribution was and what was deserved relative to his raw stats. DRC+ views Hazle’s deserved OPS as an outstanding .913, not an otherworldly 1.126, as he deserved 13 fewer hits than the 54 he received. It sees Rudi’s deserved OPS as a bad .591, not a there-were-pitchers-better-than-that .499, as he deserved more singles, walks, and doubles than he received.
And by looking at them in that light, DRC+ is predictive. Was it reasonable to expect Hazle to continue to have a 200-something OPS+, or Rudi a sub-40 wRC+? No, those are probably sample size-related variations, unlikely to recur. For players with limited plate appearances, DRC+ shrinks to the mean. The big variations for players like 1957 Hazle and 1969 Rudi are a feature, not a bug.
Again, for batters who are regulars, the differences among the three measures are generally small. This year, Khris Davis had a 136 OPS+, 135 wRC+, and 135 DRC+. In the few cases where the differences aren’t small, they’re explicable by differences in how DRC+ views what the batter deserved. For players with fewer plate appearances and extreme performances, DRC+ generally takes a more tempered view of the player’s likely contribution. I appreciate those differences, and will be using DRC+ in my analysis going forward.
Thank you for reading
This is a free article. If you enjoyed it, consider subscribing to Baseball Prospectus. Subscriptions support ongoing public baseball research and analysis in an increasingly proprietary environment.
Subscribe now
What this article seems to be suggesting is that when the sample is large enough there is no meaningful difference, but if the samples are small than DRC+ will constrain fluke outlier seasons to be more in line to a players subsequently demonstrated true talent. Is that right? That's probably useful, but not throwaway every other hitting metric because this is the best game changing.
Now perhaps this is just something one has to accept, that if it looks at single-season performance then the metric has no way of knowing that Yelich isn't getting lucky and Shaw isn't getting unlucky? And perhaps that's fine; I doubt there is a perfect metric out there that can take absolutely everything into account, and that some type of hitter will always be under- or overrated. So I'm curious what the thoughts on this are from the BP team; if it's intended and viewed as accurate, or if it's an unfortunate but acceptable side effect, or something else?
If you filter out pitchers, the Rockies have exceeded a 100wRC+ 6 times, which is quite low but not outrageously so.
(For example, the Pirates, who play in a roughly neutral park, have managed a 100wRC+ only 7 times over the same period.)