Friday night, Rays left-hander Blake Snell cruised through five innings against the Blue Jays, allowing no baserunners and throwing just 45 pitches. It was his second start back from the disabled list, following a four-inning, 59-pitch effort on August 4.
And he got pulled, joining Bob Knepper, Daniel Norris, and Rich Hill as the only pitchers in MLB history to be removed from an ongoing perfect game of five or more innings.
Take away the of five or more innings qualifier, though, and he gets company. His teammate, Sergio Romo, pitched a perfect first inning against the Angels on May 19 before giving way to Ryan Yarbrough in a 5-3 Rays win. And another teammate, Ryne Stanek, has subsequently—albeit with less fanfare—been removed from perfect games after 1 2/3 innings three times (May 26, June 18, August 3) and after two innings once (June 12).
The Rays’ unusual use of pitchers this year is not a revelation, of course. (Add to that list: From July 25 through August 8—15 days—Stanek started five games, on rest of one, two, two, one, and four days.) My BP colleague, Bryan Grosnick, coined the term “opener” five years ago. This season is the first one in which we’re seeing a team widely embrace its use. Grosnick discussed it on May 22, and his DFA Podcast co-host R.J. Anderson wrote about it as well. Travis Sawchik wrote about how the Dodgers and the Padres have deployed openers.
But the Rays have been the progenitors. And as such, they are outliers in many statistical categories. Here, for example, is the average innings pitched per start for all 30 teams through Sunday’s games. (All data in this report are from Baseball-Reference.)
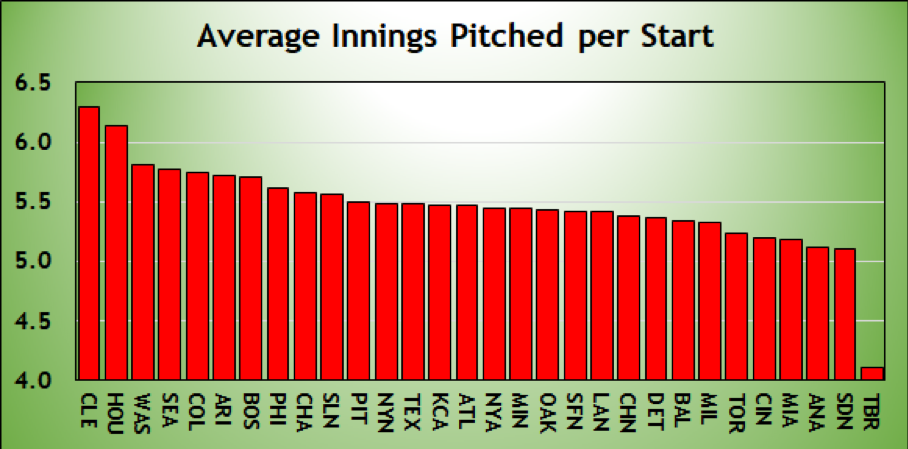
And here’s a list of all the teams in MLB history to have averaged fewer than five innings per start:
- 2012 Rockies, 4.72 innings
- 2018 Rays, 4.11 innings
The 2012 Rockies were a bad team, finishing 64-98 and costing manager Jim Tracy his job. In June of that year, they went to a four-man rotation, limiting starters to 75 pitches per outing. (They chose not to continue that experiment beyond 2012.) The Rays look like a lock to crush the record.
Here are four related charts. First, the number of pitcher starts lasting four or fewer innings this year.
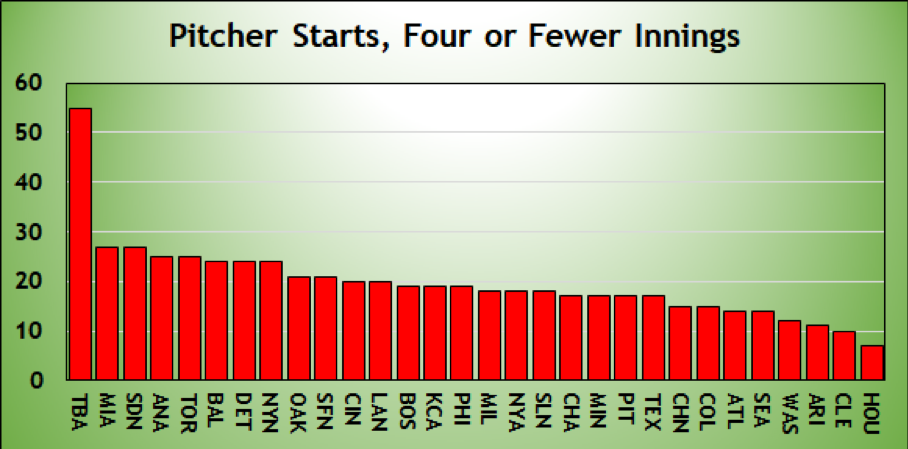
The Rays, with 55 such games, are currently third on the all-time list, trailing the aforementioned 2012 Rockies with 64 and the 1964 Athletics with 56. Tampa Bay is on pace for 76, which would be a new record.
Next, three or fewer innings.
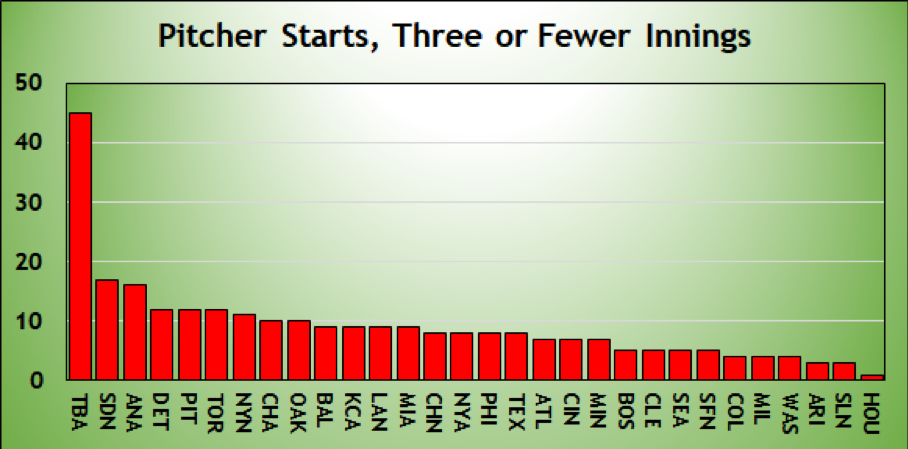
Tampa Bay, with 45, has already set the all-time record. The 1949 Browns had 40 such games, the 1913 Athletics 39, and the 1956 Senators 38.
Two or fewer innings:
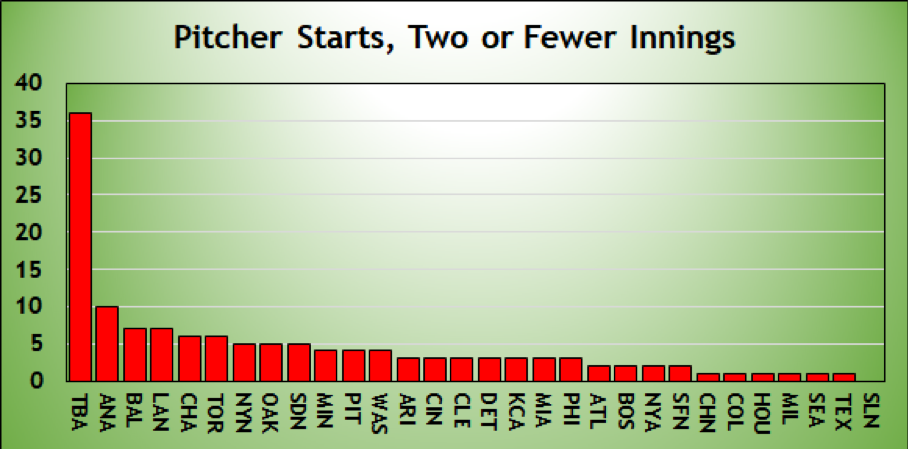
Another new record, 36, and it’s not close. Hunter Wood started and pitched 1 2/3 innings on July 26 in a 4-3 Rays victory over the Orioles, Tampa Bay’s 28th game in which its starter lasted two or fewer innings. That broke the record of 27 set by the Mariners in their inaugural 1977 season. The 1956 Senators and 1958 Dodgers had 26.
And one or fewer innings:
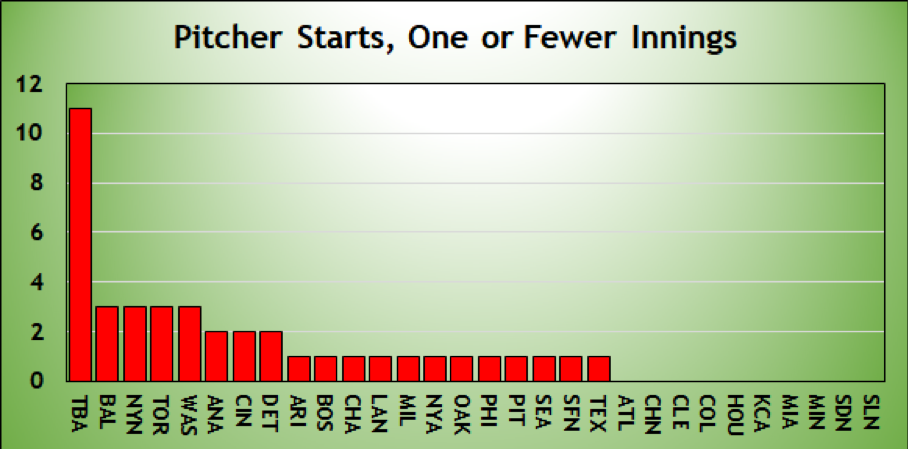
This isn’t in record territory, but it’s close. The Rays’ 11 starts of one or fewer innings ties them for 42nd on the all-time list. They’re on pace for 15, which would tie them for third. It’s not that the all-time leader, the 1928 Boston Braves with 17, discovered the opener role 90 years before Tampa Bay. Rather, as I’ve written, super-short starter outings were much more common in the past due to the availability of multi-inning relievers. In today’s game, with relief pitchers largely limited to an inning at a time, managers are reluctant to saddle their bullpens with eight-plus innings of work.
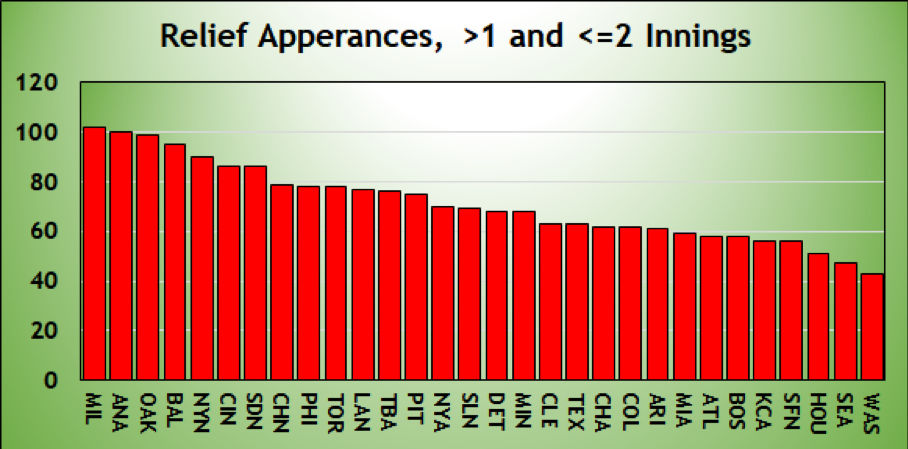
Let’s break down the Rays’ starters a little more. We’ve already established that they’re leading the majors in starts of one or fewer innings. How about starts of more than one but no more than two innings?
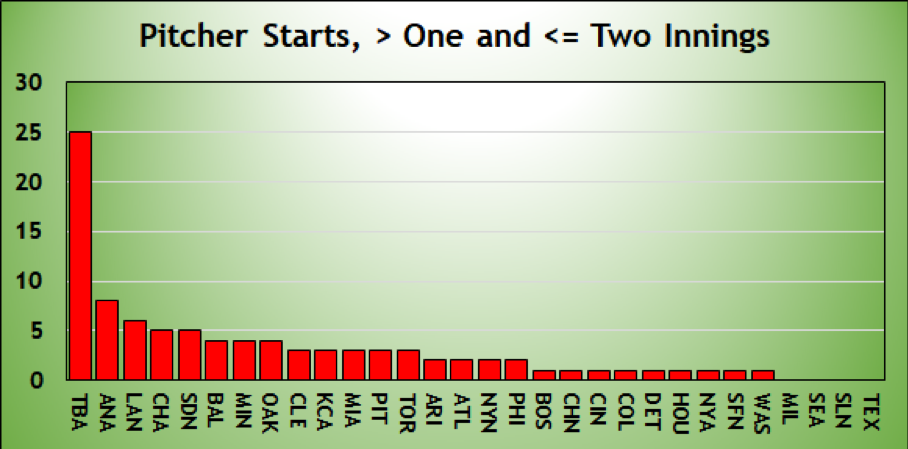
Not only are they leading the majors, they’ve already set a record, by a lot. The 1967 Senators, 1977 Mariners, and 1977 Padres all had 16 games in which their starter got 4-6 outs. The Rays could easily double that.
Here are starts lasting more than two innings but no more than three innings.
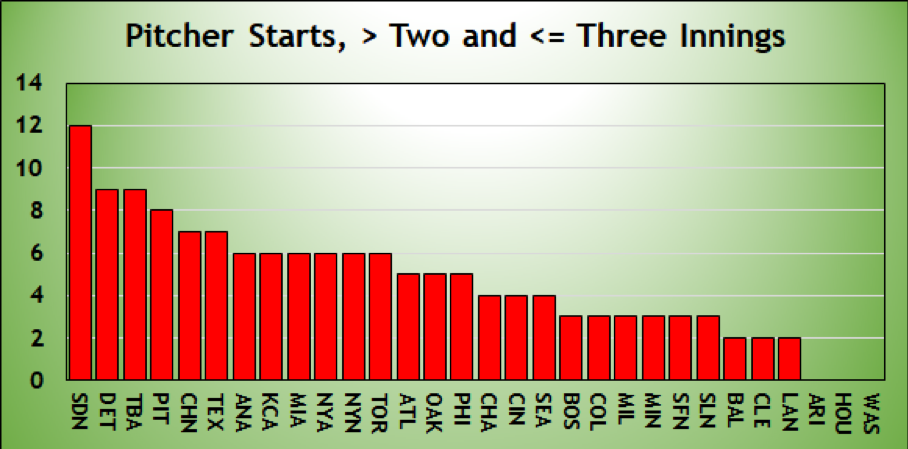
The Rays are up there, but this has been more a Padres thing. That doesn’t mean the record is safe. With 12 such games, the Padres are on pace for 16. The 1963 Senators and 1949 Browns had 19. The 1958 Senators and 2012 Rockies had 18, and eight teams had 17.
Finally, starts lasting more than three innings but no more than four innings.
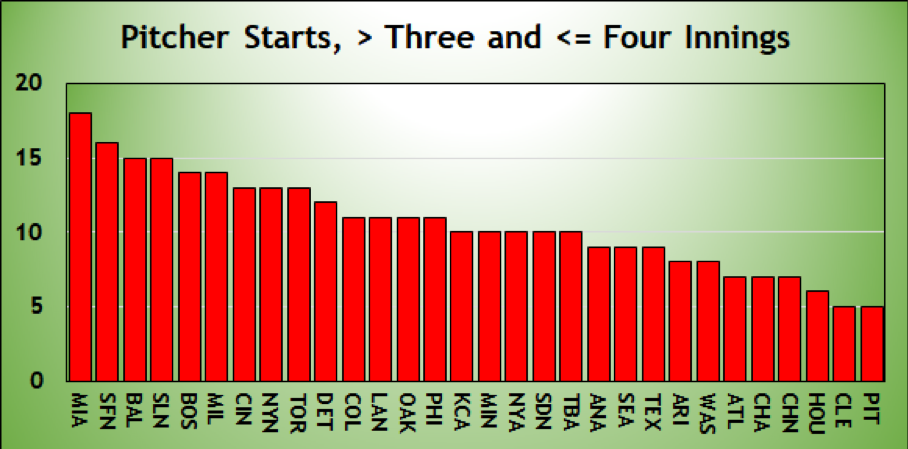
The Rays are middle of the pack, and the all-time record, 45 by those 2012 Rockies, is likely to stand for a while.
***
If the Rays’ starters are getting pulled early, that means more of a burden on the bullpen. Is Tampa Bay using an unusual number of relievers? Are their relievers staying in games longer than normal? Or both?
Here’s the number of relief pitchers used per team per game.
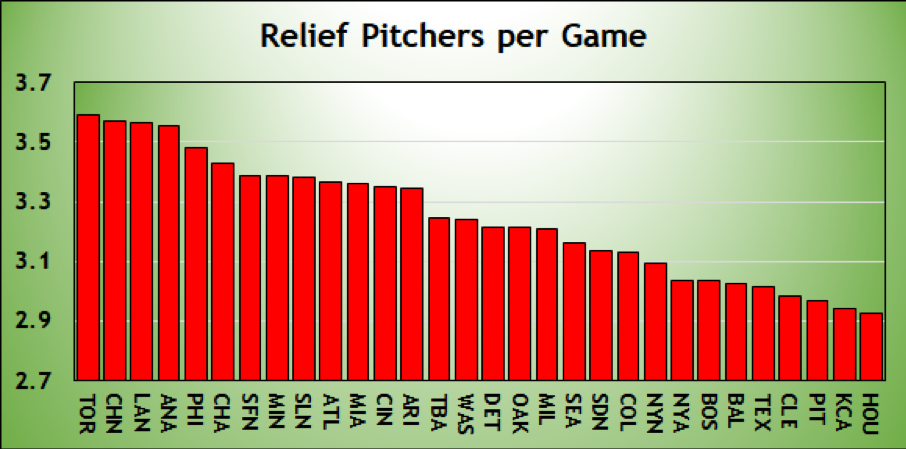
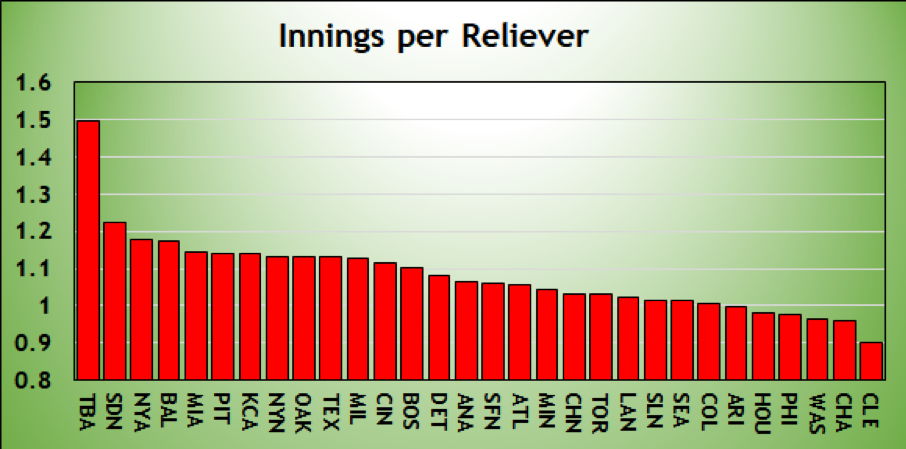
Nothing unusual. So, if it’s not the quantity of relievers, it has to be the quantity of innings pitched by those relievers, right? Here’s the average relief outing per team, in innings.
What has made the Rays outliers? Here’s the number of relief appearances per team that lasted more than an inning.
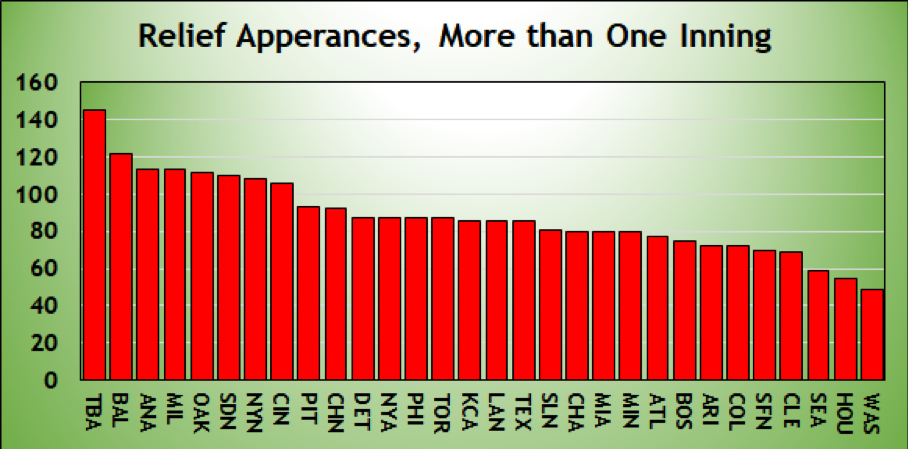
The Rays are approaching record territory. The 1985 Braves had 201 relievers pitch more than an inning. Tampa Bay is on pace for 199.
So let’s break it down. Relief appearances of more than one inning but fewer than our equal to two innings?
Nothing unusual here. The Rays are not outliers, and the record of 150 by the 1985 Braves and 1992 Astros is safe.
Here are relief appearances of more than two innings but no more than three.
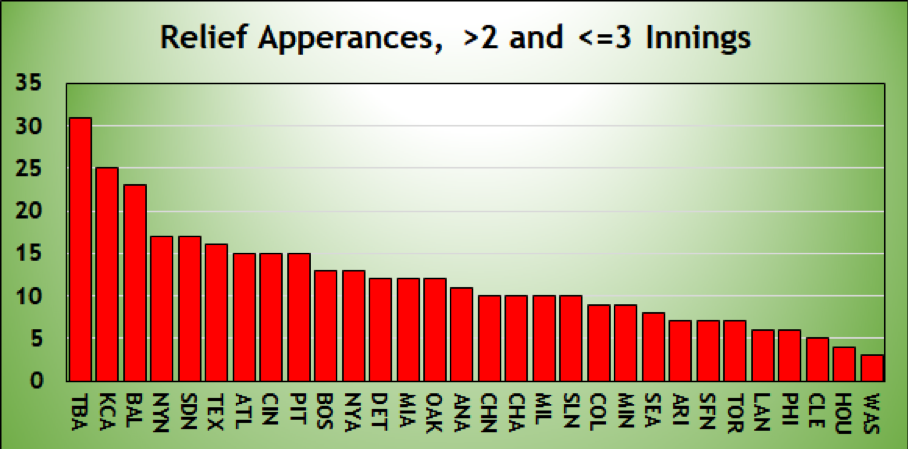
Tampa Bay emerges as the leader, but not by a lot. They won’t come close to the 1982 Braves, whose relievers had 57 such appearances.
The Rays are getting separation when we look at outings lasting more than three innings but not more four innings.
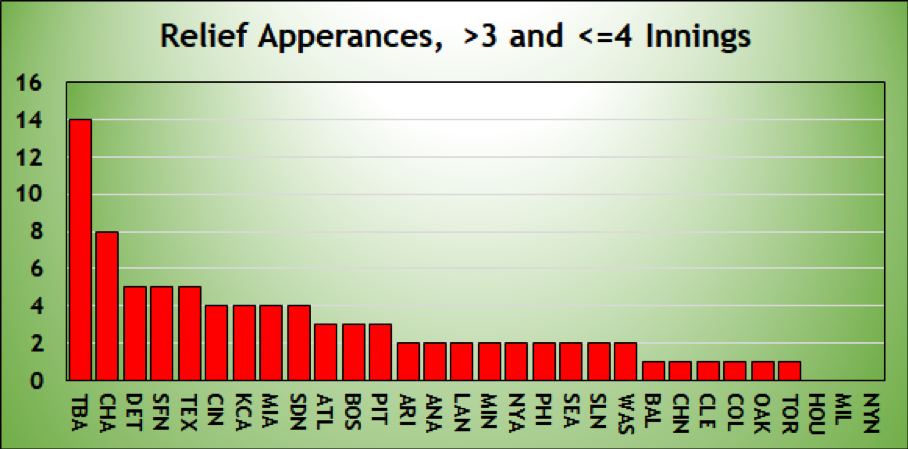
The 1982 Red Sox had 40 relief appearances of this length. The Rays are nowhere near the record.
Finally, relief outings of more than four innings.
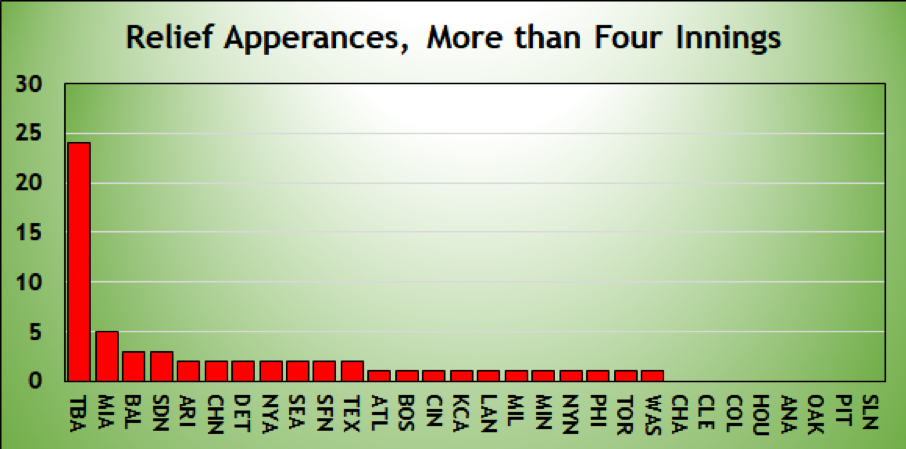
The Rays have 24 such games already and seem likely to finish in the neighborhood of the 1912 Dodgers’ record 36. This is directly a result of the opener strategy. Those 24 long relief outings are not evenly distributed. Here’s who’s gotten them:
- Ryan Yarbrough, 9 games
- Austin Pruitt, 6 games
- Jalen Beeks, 2 games
- Yonny Chirinos, 2 games
- Vidal Nuno, 2 games
- Anthony Banda, 1 game
- Chih-Wei Hu, 1 game
- Ryan Weber, 1 game
Of those games, I’d argue that seven of them (three by Pruitt and one each by Yarbrough, Chirinos, Nuno, and Hu) are your basic garden-variety long-relief outing, with the reliever coming in early for a starter who was ineffective or injured, or the bullpen needing a breather. But that means 17 games were of the opener variety. That’s why the Rays have had so many relief appearances of more than four innings.
***
Will this strategy take hold across baseball? It’s facile to say that MLB is highly imitative. As you’ll recall, the 2015 Royals’ focus on contact in lieu of walks and strikeouts and homers didn’t exactly take hold. And those Royals were World Series champions.
What gets imitated? Stuff that works. The 2015 Royals didn’t walk a lot nor hit homers, but neither did the White Sox that year, and they were 76-86. That didn’t work. So it didn’t get imitated.
The Rays? They’re 8-11 in Ryne Stanek’s opener starts. They’re 5-1 with Hunter Wood. Sergio Romo, 2-3. Matt Andriese and Andrew Kittredge, 1-1 each. Tyler Glasnow, 1-0. All told, Tampa Bay opener starts have yielded an 18-17 record, for a .514 winning percentage. The team in its other games is 42-41, for a .506 winning percentage. That doesn’t strike me as the type of difference—it works out to 1.3 wins over the course of a season—that drives imitation, although certainly there are other factors.
But records? Yeah, the Rays are definitely going to give us records.
Thank you for reading
This is a free article. If you enjoyed it, consider subscribing to Baseball Prospectus. Subscriptions support ongoing public baseball research and analysis in an increasingly proprietary environment.
Subscribe now
The W-L comparison didn't strike be as apt since wouldn't regular starters (i.e. non-Opners) be better than trad starters who don't open?
If W-L record in games in which the run-of-the-mill trad starters who don't open is about the same as the games in which regular starters do start, isn't that a credit to the strategy? Hope I'm clearer this time.