
Around this time last year, we introduced some new data based on a not-so-new phenomenon known as pitch tunneling. While we would never claim to have invented the phenomenon, we are proud to have taken major steps forward in quantifying it in Major League Baseball. We set out to quantify the distance between pitches at three primary points, two of which had long been quantifiable previously: at release, at the batter’s decision-making point, and at home plate.
The new point–the batter’s decision-making point–proved challenging, as it required some not insignificant effort to recreate the trajectory of each pitch based on the available data before isolating their position in 3D space at the point we identified as the batter’s decision-making point. We go into depth on the rationale for that point in the introduction post from last January, so we won’t belabor it too much here.
What we do want to do, however, is point out the major updates we’ve made to the data that will now be available on the site, as well as why we’ve decided to make the updates we’ve made.
Point of View
When we released the pitch tunnel data last year, it made perfect sense to do so from the point of view that most all pitching data is visualized: the catcher’s. However, that decision was incongruent with our aim to “think like a hitter.”
As such, the most significant update to the data today is that it is calculated from the batter’s perspective, approximately. We estimate the actual position of their eye based on their height, known batting stance information from Gameday, and research conducted by Mike Fast. While the catcher’s point of view is old hat at this point, the right-handed hitter (RHH) and left-handed hitter (LHH) points of view should be fairly new to most of us, despite the idea being roughly a decade old itself. Fast, who is now with the Astros, suggested in 2008 that there would be additional insight from viewing pitches from the batter’s point of view, and laid out a methodology for doing so.
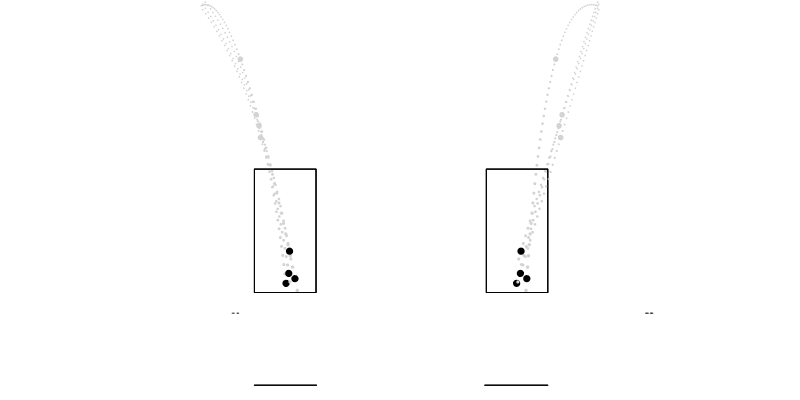
The image above was an early model for changing the perspective for our pitch tunnel data. This is one sequence from Chris Sale, as seen by a lefty and a righty. It’s clear that hitters from different sides of the plate see things differently. We felt that, to be as accurate and realistic as possible, this was an important thing to capture. Subsequent efforts at visualizing pitches ring more true to the actual thing hitters see when they’re in the batters’ box, as you’ll see in a bit.
In order to get there, we have taken Fast’s method and (hopefully) improved upon it in myriad ways. First, his method makes no adjustment for vertical perception, which is something on which we were insistent. Not only have we generated a method to view pitches from a higher vantage point than the catcher’s, we’ve also crafted a mathematical approach to generating distinct view heights for every player in baseball based upon their listed height. More on that in a bit.
Other tweaks were made to Fast’s approach, allowing us to better visualize what a batter saw in any matchup from any game. These new perspectives provide the opportunity to uncover new insights not just about pitchers and how their pitches appear to batters, but also what batters are seeing throughout the course of an at-bat. We believe that these visualizations provide ample opportunity for learning and exploration, and we hope that you feel inspired to explore them for yourself.
The Tunnel Point
When we rolled out this new data we estimated the tunnel point to be roughly 175 ms before the ball crossed home plate. Computationally that was challenging, so we adjusted to simply use a fixed point–23.4 feet from home plate–as our tunnel point. While effective in the short term, it had its limitations. Fastballs travel that last 23.4 feet much faster than curveballs do, meaning that the time between the tunnel point and home plate could vary greatly. For this update we set out early on to make the data time-based.
We also wanted to account for what Dan Brooks called the “earliest and greatest difference” between pitches. That is, it’s irrelevant how far apart two pitches are at the tunnel point if they were very far apart at release, allowing a hitter to figure it out before the ball left the pitcher’s hand. In discussions with pitching and hitting coaches, as well with as academic researchers, a singular idea came to the forefront repeatedly. For a batter, it’s not a matter of deciding if they are going to swing at a pitch, but rather whether they see something that stops them from swinging. Our research and development around this topic has centered around the idea of cues, indicators that help a batter identify whether they should continue swinging or not, and if so, where.
The idea of cues is a critical one because it helps articulate our belief that batters are accumulating information throughout the entire delivery that informs their decision as the ball is in flight. As a result, our new data includes the largest differential between sequential pitches at any point prior to the tunnel point. In the vast majority of cases, that will be at the tunnel point itself, but that’s not true 100 percent of the time and so it was a worthwhile inclusion. This means that when you see the tunnel differential, it’s representing one of those primary cues, at any point prior to the point of no return that informs the batter.
The tunnel point itself is changing as well. While our previous measurements were initially based on what we believed to be the commitment point for batters, we now believe that to have been about 25 ms too early. Following conversations with a variety of academic researchers who study the perception and eye-tracking abilities of the human eye and brain, we’ve changed our tunnel point to 150 ms in front of home plate. It’s worthwhile to discuss why we’re changing this point and the implications of it in greater detail.
A recent study by researchers from Waseda University, Nara Women’s University, Fukuoka University, and Ritsumeikan University in Japan looked at the impact of perception on pitch trajectories and swing accuracy. Their resulting paper, Contribution of Visual Information About Ball Trajectory to Baseball Hitting Accuracy, published in Plos One, includes the following passage that’s particularly relevant to our decision of moving the tunnel point to 150 ms from home plate (bolded emphasis ours):
The lack of significant differences in the mean error and standardized variability of the impact Z deviation between the A-150 and NO conditions suggests that visual information about the final one-third of the ball trajectory did not contribute significantly toward improving baseball hitting accuracy. As a pitched ball travels near the home plate, the angular velocity of eye movement required to track the ball exceeds the physiological limit of the human eye [12,26]. Although experienced batters possess a superior ability to track fast moving objects [12,27] and utilize head movement in addition to eye movement to track the ball [12,28], the final phase of ball movement may be too fast to track. In addition, because of the visuo-motor delay [7,8], batters may not be able to utilize the visual information about the ball trajectory right before the ball-bat contact, thus they must decide where to swing based on their prediction of the ball trajectory. The present study confirms that there is a directional specificity in the magnitude of variability with different visible time and a limitation in the effectiveness of visual information about ball trajectory for improving the hitting accuracy.
Their study found that the batter likely couldn’t physically track the ball during the final 150 ms of its flight, a finding corroborated by studies conducted by Dr. Rob Gray of Arizona State University. There are a number of reasons for this, primarily tied to the ways in which the human eye tracks projectiles like a baseball pitch. This is despite the fact that professional baseball players have excellent vision on average, and are much better than the average person when it comes to visual acuity.
Our eyes track moving objects through two primary methods: smooth tracking and saccades. Smooth tracking is exactly what it sounds like–objects with lower angular velocities in our view can be tracked smoothly by the eyes as they move through 3D space. Fast-moving objects, however, can eclipse the maximum angular velocity of the eye itself, requiring a saccade–a “jump” where the eye and brain coordinate to skip ahead and move to the projected position of the object at a point further along its path.
When a pitch travels too fast for the eye to track, the eye skips ahead in the projected flight path, often to the expected point of contact. This means that not only is anything that happens in the last 150 ms too late for a batter to adjust their swing in any way, it’s likely that they aren’t even actively looking at the ball beyond that point.
What You’ll See
There are two major updates for parties interested in accessing the pitch tunnel data on the site as a result of these changes. The first is related to the data, that you will still find on the stats pages here.

The data, updated in accordance with the above changes, now has a several different fields that you’ll want to familiarize yourself with. Those are:
Release Distance – This stat tells us exactly how far apart two back-to-back pitches are released. This is the true distance between pitches, meaning it is the exact amount of space between the ball on release.
Example: Justin Verlander‘s release points vary by 2.2 inches on average. The average in our sample (2017, pitchers with more than 100 pairs) is 2.6 inches.
Data: This is found in the column “RELDIST” on our stats pages.
Pre-Tunnel Max(imum Distance) – This stat tells us the distance between back-to-back pitches at the decision-making point, as seen from the batter’s point of view. This is the perceived distance between the pitches as seen from the batter’s viewing angle. Since this isn’t the exact distance between two pitches, it will sometimes be smaller than the Release Distance.
Example: Justin Verlander‘s pitches have a perceived distance of 1.45 inches prior to the tunnel point. The average across our sample was 1.54 inches.
Data: This is found in the column “PREMAX” on our stats pages.
Pre-Tunnel Max Time – This stat tells us when the second pitch in the pitch pairing is at its greatest perceived distance from the one preceding it. With the shift to earliest and greatest differential, this time tells you how much remaining flight time the pitch has before reaching the plate. This number will always be greater than 0.150 (or 150 ms), and the closer this number is to 0.150, the later the pitches separate in flight.
Example: Justin Verlander‘s pitches have their average greatest differential with roughly 169ms of flight time remaining (0.169 seconds); that’s 19 ms before the tunnel point and exactly the same as the average in our sample.
Data: This is found in the column “PREMAXTIME” on our stats pages.
Plate Distance – This stat tells us how far apart back-to-back pitches are from each other at home plate. This is the true distance between the pitches at the plate.
Example: Justin Verlander‘s pitches end up 17.5 inches apart at the plate on average. That plate distance is slightly smaller than the average from our sample of 18.2 inches. Differences in plate distance are often driven by pitcher arsenal and sequencing.
Data: This is found in the column “PLATEDIST” on our stats pages.
Flight Time Differential – This is the absolute value of the difference in the flight time between the two pitches under consideration. As a result, this provides an insight into how a pitch changes speeds between back-to-back pitches by looking at the total flight time of pitch 1 vs. pitch 2.
Example: Justin Verlander‘s average pitch pairing varies in flight time by 0.023 seconds (23 ms), slightly less than the average from our sample of 0.026 seconds (26 ms).
Data: This is found in the column “FTIMEDIFF” on our stats pages.
Plate:PreMax Ratio – This ratio highlights the difference between the perceived distance prior to the tunnel point and the true distance at the plate for the second pitch in a pairing. This ratio highlights how much of a pitcher’s difference in plate location comes from movement after the batter’s decision-making point.
Example: Justin Verlander‘s Plate:PreMax ratio in 2017 was 12.1, meaning that his pitches ended up 12x further apart than the batter perceived them to be prior to the point of no return. The average in our sample was 11.9, indicating that Verlander has a smaller tunnel on average than the average pitcher.
Data: This is found in the column “RATIOPLATETOPREMAX” on our stats pages.
***
In addition, we have an exciting new development related to pitch tunnels. We’re releasing an interactive tool that will let you visualize any plate appearance from the 2017 season, complete with pitch data and tunnels information for sequential pitches. This visualization is fully interactive, allowing the user to select the plate appearance they’re interested in and receive not only a visualization of the exact pitches thrown along with trajectories and locations but the corresponding data for those pitches.
You will now be able to go back and look at any plate appearance from 2017 and see exactly what the batter saw. For example, here’s one plate appearance between Clayton Kershaw and Jason Heyward:
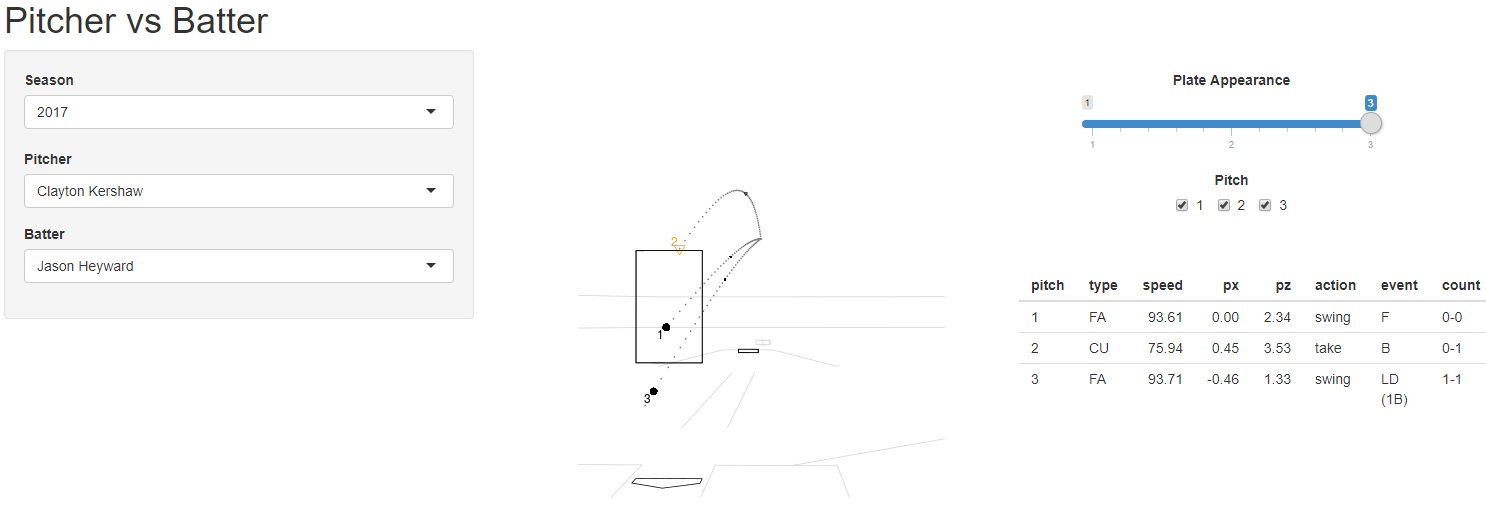
We built this tool to allow you to dig into any plate appearance you want, so make sure to check out our Interactive Matchup Tool and see what it’s like to be a major-league hitter.
These visualizations include a number of things, so we’ll give you a quick explainer. The grey dotted lines represent the flight path of each pitch, with dots spaced out at even intervals. The slider at the top allows you to switch between the various plate appearances the batter had against the pitcher last season. The shapes and numbers at the plate correspond to the pitch types and order, which you can toggle at will in the top right section with the check boxes, just below the plate appearance selector. There are also small black shape indicators on the flight paths that indicate the tunnel point for each pitch.
When you choose a different batter, the view will adjust to match their point of view. This means you’ll get a different view if you select a left-handed hitter or a right-handed hitter. It’ll also adjust based on the height of the batter, so things look different for Aaron Judge than they do for Jose Altuve.
Hopefully these visualizations prove useful in understanding exactly what major-league hitters see as they face the best pitchers in the world.
Conclusions
We believe that this improved data and new tool will change the way we think about and analyze pitching. So much of what we’ve been able to pull together has been powered by dozens of people who have lent their expertise and feedback that has enabled us to deliver useful analytical tools to the public.
Below you will find three lists, each of which is important in its own ways. The individuals listed in the “Thank Yous” have helped shape and direct our understanding of this phenomenon and our ability to provide useful tools for analysis of pitching and hitting. The “Favorite Tunnels Work” is some of the pieces that were written over the past year on this topic that we really enjoyed. Finally, the “Resources” section includes research–academic or otherwise–without which these updates wouldn’t be possible. If you enjoy digging into the details of what we’ve changed and why, you’ll really enjoy digging through the items listed in our resources section.
Thank Yous
The conversations, work, feedback, and insights from these individuals made this update possible. We’re greatly in their debt, and without them none of this would be possible.
Martin Alonso Baseball Prospectus Stats Team, developer of the matchup tool.
Kate Morrison Baseball Prospectus Stats Team
Jonathan Judge Baseball Prospectus Stats Team
Dr. Rob Gray Arizona State University
Access Rob’s full list of baseball-related research papers here.
Dr. Peter Fadde Southern Illinois University; Co-Founder, GameSense Sports
Wayne Boyle Founder, PitchGrader
Kyle Boddy Founder/Director of R&D, Driveline Baseball
Matt Daniels Director of Pitching, Driveline Baseball
Mike Fast Director of R&D, Houston Astros
Some of Our Favorite Tunnels Work:
Since we published our initial research on tunnels last year, we’ve been impressed and humbled by the work done by analysts using the data and insights related to tunneling. Here are some, but certainly not all, of our favorite pieces from the last year.
- https://www.birdsontheblack.com/blog/sinker-slider-sequence-key-for-carlos-martinez-versus-lefties
- https://www.pinstripealley.com/2017/2/5/14477568/yankees-michael-pineda-nathan-eovaldi-command-control-deception
- https://www.beyondtheboxscore.com/2017/2/1/14456010/kershaw-dodgers-pitching-stats-command-tunnels
- http://wrigleyville.locals.baseballprospectus.com/2017/02/01/jon-lester-and-pitch-tunnels/
- https://www.beyondtheboxscore.com/2017/2/8/14530314/rich-hill-john-lackey-drew-smyly-pitching-tunnels-sabermetrics
- https://www.baseballprospectus.com/news/article/32798/rubbing-mud-the-sinker-doesnt-play-well-with-others/
- https://www.baseballprospectus.com/news/article/31335/rubbing-mud-dan-strailys-maybe-changing-two-seamer/
- https://www.baseballprospectus.com/news/article/31222/rubbing-mud-carlos-martinez-tunnels-and-pecota/
- https://www.baseballprospectus.com/news/article/31100/rubbing-mud-further-frontiers-vision/
- https://www.fangraphs.com/blogs/what-the-dodgers-asked-yu-to-do/
- https://www.baseballprospectus.com/news/article/32790/prospectus-feature-tunnels-and-sequencing-applications-on-the-field/
- https://www.baseballprospectus.com/news/article/34158/prospectus-feature-perception-deception/
- https://www.baseballprospectus.com/news/article/32730/pitching-backward-an-ode-to-the-slider/
- https://www.baseballprospectus.com/news/article/32199/prospectus-feature-measuring-pitcher-similarity/
- https://www.baseballprospectus.com/news/article/31032/baseball-therapy-lets-dig-into-these-tunnels/
- https://www.baseballprospectus.com/news/article/32453/contours-in-batter-comparisons-a-trick-up-the-sleeve/
Resources:
These works helped shape the direction we took our pitch tunnels work and are a terrific read if you’re interested in learning more about the topic and how we think about the batter-pitcher matchup.
- https://www.fangraphs.com/blogs/neuroscience-can-project-batting-lines-now/
- http://www.ajo.com/article/S0002-9394(14)72106-3/pdf
- http://www.cell.com/current-biology/fulltext/S0960-9822(14)00005-0?_returnURL=http%3A%2F%2Flinkinghub.elsevier.com%2Fretrieve%2Fpii%2FS0960982214000050%3Fshowall%3Dtrue
- https://www.bostonglobe.com/sports/2015/02/18/neuroscouting-may-give-red-sox-heads-prospects-potential/EFBHR3zNdThk1NboRpNMHL/story.html
- https://www.ncbi.nlm.nih.gov/pubmed/12421060
- https://www.ncbi.nlm.nih.gov/pubmed/12430839
- https://www.ncbi.nlm.nih.gov/pubmed/17556776
- https://www.ncbi.nlm.nih.gov/pubmed/19586249
- https://www.ncbi.nlm.nih.gov/pubmed/20949857
- https://www.ncbi.nlm.nih.gov/pubmed/28355838
- https://www.fangraphs.com/tht/pitch-tunneling-is-it-real-and-how-do-pitchers-actually-pitch/
- http://perceptionaction.com/pitchtunnels/
- https://www.researchgate.net/publication/7235530_Unconfounding_the_direction_of_motion_in_depth_time_to_passage_and_rotation_rate_of_an_approaching_object
- https://www.nature.com/articles/nn1389
- http://perceptionaction.com/horizinfo/
- http://journals.plos.org/plosone/article?id=10.1371/journal.pone.0148498
Thank you for reading
This is a free article. If you enjoyed it, consider subscribing to Baseball Prospectus. Subscriptions support ongoing public baseball research and analysis in an increasingly proprietary environment.
Subscribe now