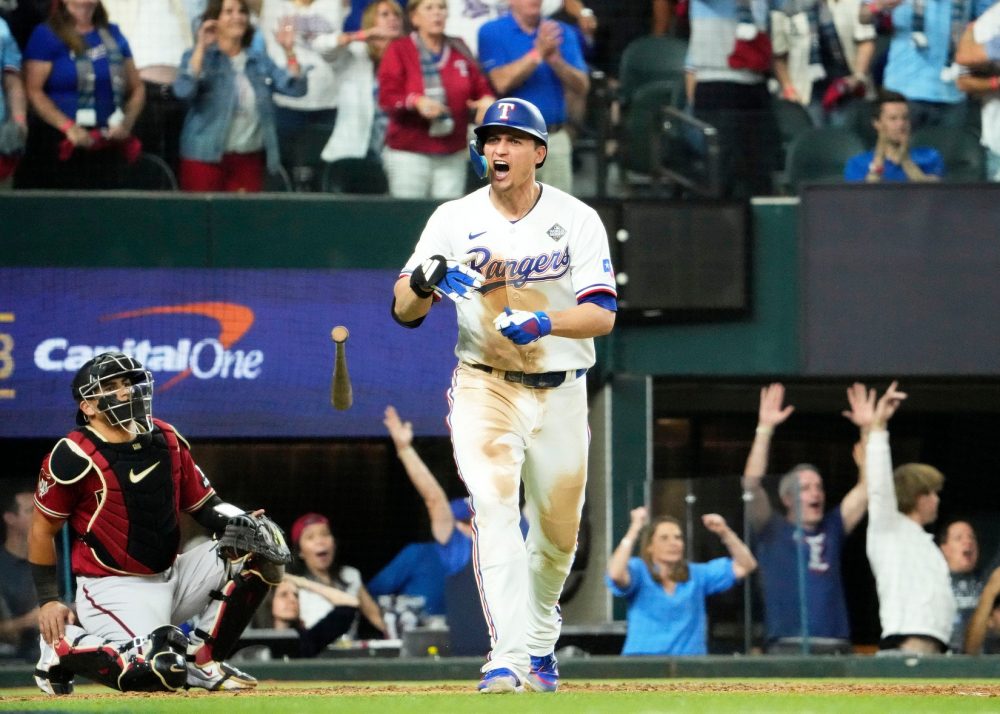
The Rangers are celebrating their first World Series championship in franchise history for a number of reasons. Because of clutch showings from Nate Eovaldi and Jordan Montgomery all postseason long. Because of well-timed hot streaks from seemingly the only two reliable arms in an otherwise shaky bullpen in Jose Leclerc and Josh Sborz. Because of clutch performances in long relief from Jon Gray; the list goes on and on. Every champion has such a list. But there can be no doubting the driving force behind this Texas title: Their incredibly deep and productive lineup, one that had no holes from leadoff hitter Marcus Semien to ninth hitter Leody Taveras.
The lineup that stole the most headlines during the regular season played at Truist Park in Atlanta, and it was fairly easy to point to what the Braves did well: 307 home runs speaks for itself. While Texas certainly features hitters capable of incredible power—Corey Seager, Adolis Garcia, Mitch Garver, and Ezequiel Duran were all in the top 20% of the league’s hitters in 90th percentile exit velocity, with Nathaniel Lowe not much further behind—their lineup was able to grind away pitchers with more than brute strength. The lesson we can learn from this year’s champs is that when putting together a World Series-winning lineup, it helps when nearly every hitter on the roster possesses an advanced understanding of the zone, the count, and how to leverage those two things together to get pitches they could do damage on.
The interaction of those skills materialize in sometimes difficult to track ways using public metrics. A typical analysis of a hitter’s plate discipline would begin with their chase rate—or O-Swing percentage—which measures how often they expand the zone, aka swinging at pitches they shouldn’t. It’s the most commonly referenced metric for analyzing a hitter’s approach; Juan Soto leads the league in this area year after year while Javier Baez rates among the worst, as one might expect. The Rangers, depending on which site you’re using, generally rated as one of the most disciplined teams by chase rate in the league. They were fourth-best by PitchInfo, sixth by Statcast, and fifth according to Sports Info Solutions (each site defines the boundaries of the strike zone in their own way, which leads to the differences between these metrics quantifying the same thing).
Chase percentage, for all its merits, doesn’t tell the whole story. Despite a seemingly intuitive relationship with quality of contact—pitches further from the zone are harder to put good wood on—it doesn’t have much of a statistical relationship with any of the more ubiquitous power measures. For example, with isolated slugging (ISO)—the difference between a player’s slugging percentage and batting average, effectively representing a player’s “extra base hits” skill—chase rate has a fairly weak correlation (r of -.105 for 2020-2023). Instead, it has a much stronger relationship with a player’s walk rate (r of -.79 with BB%). It’s not measuring a hitter’s ability to recognize pitches they can hit, but instead it quantifies a player’s knowledge of the zone. The skills are related, but not the same.
Take Corey Seager—now a two-time World Series MVP, Seager has arguably the purest approach in the game for a hitter. That’s reflected not by his chase rate—that’s pretty much league average—but by his aggression on pitches in the zone relative to that chase rate. Seager is routinely among the league leaders in zone swing (Z-Swing) rate minus chase rate (O-Swing)—otherwise known as Z-O Swing.
While Seager’s Z-O Swing ratio clearly quantifies some exceptional skill that he appears to possess, the addition of zone swing rate only bumps the correlation to ISO to a .253 r. The improvement does hint at how we should be thinking about swing decisions, though. The important thing about the pitches that Seager swings at isn’t that they’re strikes. It’s that they’re hittable, regardless of balls and strikes, because of their location. Letting a hittable pitch land in the zone often leads to worse outcomes down the road for a hitter. The key part of making any decision is weighing up the benefits of an action vs. the cost of inaction. For Seager, that equation is straightforward: if he’s able to drive it then he hits it, and if he can’t then he doesn’t. He’s not waiting for a specific pitch that may never come, but just the first one that he can damage. In that way he never cedes control of his at-bats to the pitcher. Pitchers can hide their fastballs from hitters who hunt them, but they can’t stay out of the zone altogether if they want to stay in the game very long.
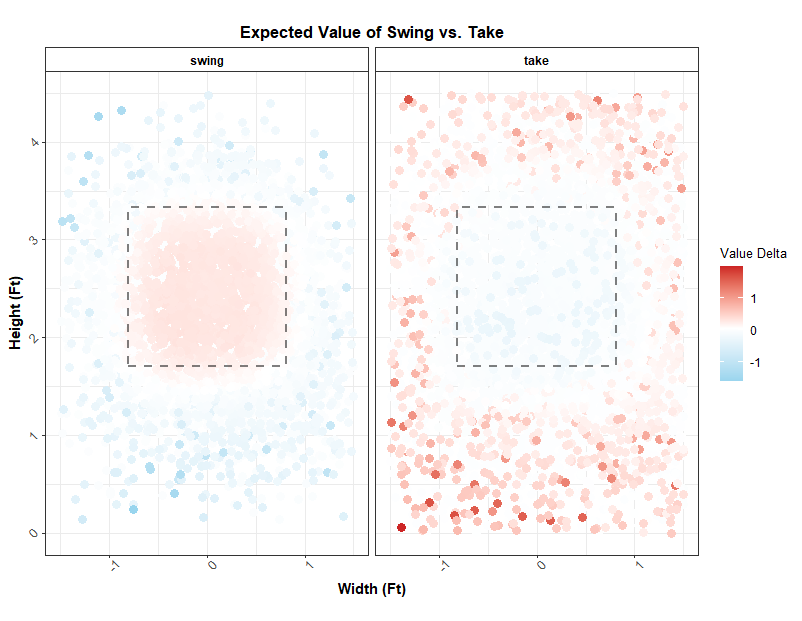
With that in mind, I wanted to measure the cost-benefit of each possible decision a hitter can make in a way that would be more statistically relevant than Z-O Swing. The quick and dirty of that process: I looked at every pitch since 2020 and found the average run value of a swing and a take at each combination of count and location around the plate. I weighted each of those values by the probability of a called strike, so that the edges of the zone would reflect the 50/50 nature of those calls, then I found the difference between the two to show the total “value” that was up for grabs. Broken out by swings and takes, that looks like this:
Looking at just swings, we get this when we further separate into the counts in which the pitch was thrown:
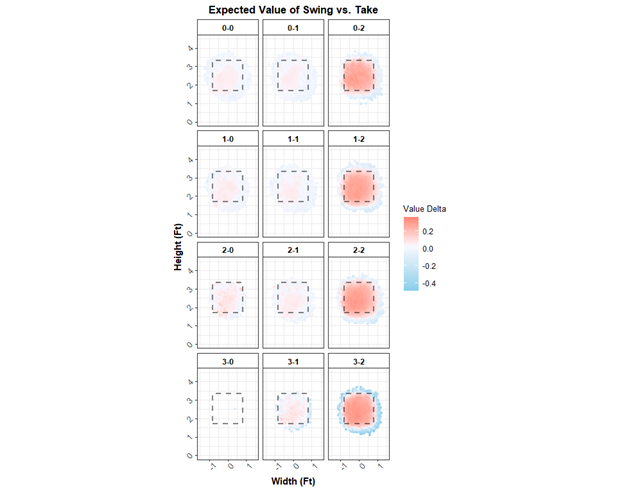
What this shows is that with two strikes, a hitter should always swing at anything with a reasonably high chance of being called a strike, which makes intuitive sense. It also penalizes players with increasing severity for swinging outside the zone when they’re about to be gifted a walk, and rewards players for swinging at pitches in the heart of the zone in nearly any count. Importantly, the penalty for being overly aggressive early in an at-bat is substantially smaller than it is later in an at-bat, incentivizing early swings—within reason—unless a hitter can confidently handle a two-strike count.
Using these deltas between the average values of a swing and a take, we can succinctly grade a player’s swing decisions by looking at whether they added or subtracted to their expected value on each pitch.
Following the same logic as Z-Swing minus O-Swing comparing good choices to bad ones, we’ll look first at an area in which Corey Seager shines: not letting those hittable, high-value pitches by him. For our purposes, that means looking at how many of a player’s taken pitches were positive expected values, aka “hittable.” A lower percentage is better here, since the idea is that deciding not to swing is turning down a chance to do damage. Among players with 200+ PA in 2023, here are the leaders (left, in blue) and laggards (right, in orange) in Hittable Pitches Taken (as a percentage of total takes):
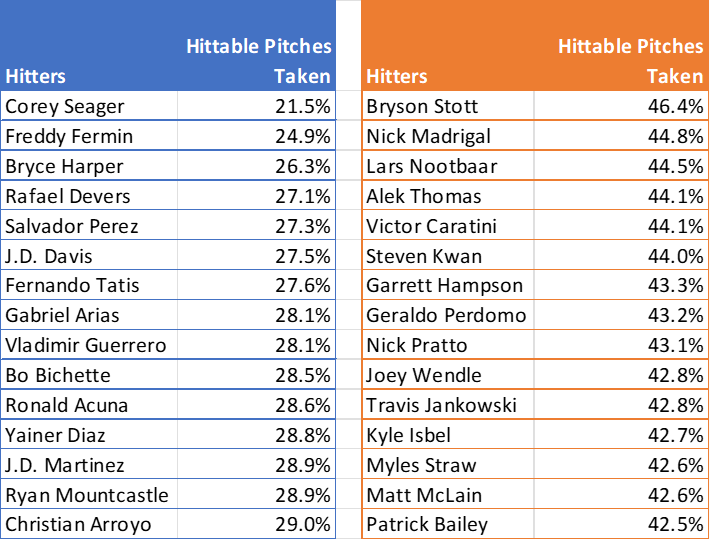
Surprise! Corey Seager sits atop the measure he inspired, letting fewer favorable pitches go unpunished than any other hitter. If it seems like some of the other names on either side are seemingly out of place for a plate skills leaderboard, remember that this isn’t tracking balls and strikes judgment: It’s looking at how opportunistic each hitter is. Basically, this measures aggression when the hitter sees something they can do damage on.
On the other side of the spectrum, the hitters on the right were generally deemed too forgiving towards pitchers—nearly half the pitches Bryson Stott took were potentially hittable, which makes sense when you think about his stated plan of laying off high fastballs in 2023 and his comfort level hitting with two strikes. That approach mostly worked out okay for him, but the implication here is that he’s leaving damage on the table by being overly passive.
If that measures aggression, now we need a proxy for selection. For that we’ll look at how many of the good decisions a hitter makes that were the result of not swinging at bad pitches. This is their capability or tendency towards being selective. A higher number is better here; a low total can indicate bad pitch recognition or a reckless approach. Compare the leaders and laggards to see what I mean:
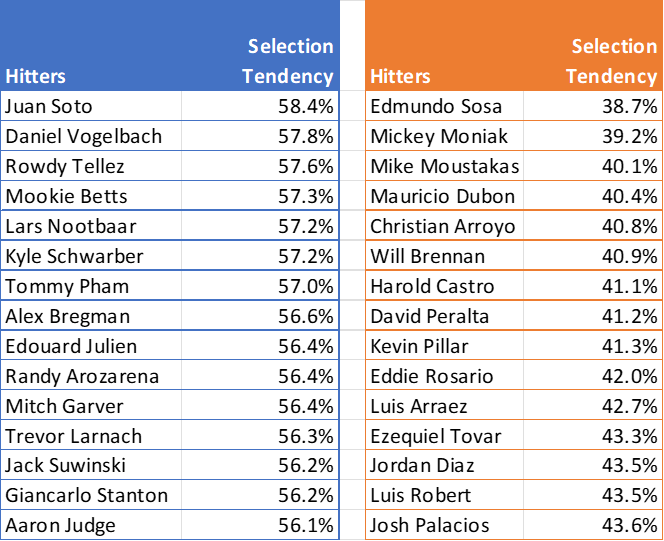
The hitters on the left are some of the choosiest in the game, and also some of the names we most associate with patience. Most of the players on the right can be safely categorized as “free-swinging.”
The final step is comparing our two numbers. The difference between these ratios gives us a “Z-O Swing-like” figure that represents how well a hitter balances opportunism with caution. Since he’s the patron saint of selective aggression (and because this produces a unit-less number that’s hard to describe), we’ll call this SEAGER: for SElective AGgression Engagement Rate. That leaderboard looks like this:
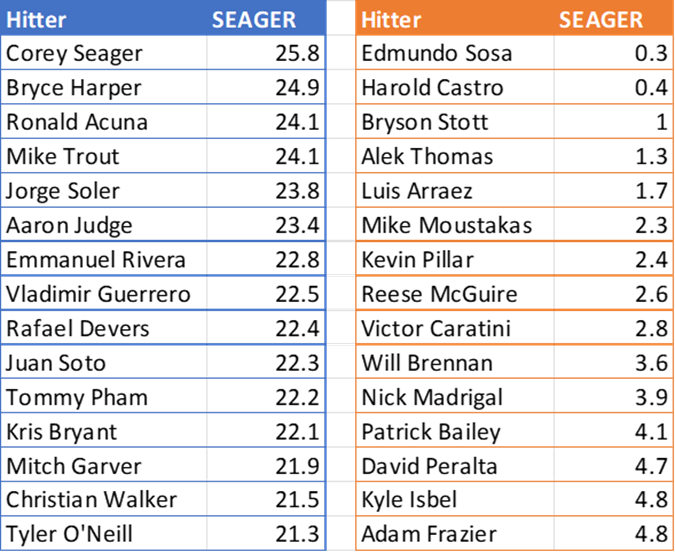
This new metric gives us an appraisal of how well a hitter stays on the front foot while retaining enough discipline to navigate the count and eventually accept free passes to first base. It’s a bit of an inelegant statistic because—like Z-O Swing—it’s an interaction of ratios with different denominators, but it still bears a stronger relationship with key offensive statistics than both Z-O and chase rate have in both the present and in future seasons:
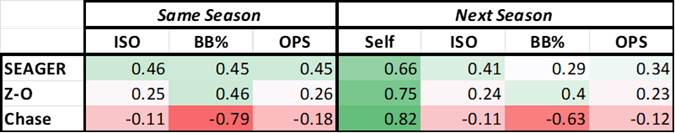
Without factoring in a hitter’s unique power potential in any way—something I’ve tried to do before, unsuccessfully—we’ve reached a weighted correlation of .41 with next season ISO based solely on a hitter’s swing decisions. That’s pretty good! SEAGER is somewhat less reliable—meaning correlated with itself—than both of the alternatives (definitely a drawback), but better explains power production in the short and long term, which was the ultimate goal here. Mission accomplished.
Let’s do a quick recap before we go:
- Plate discipline is more than just drawing walks
- What you swing at—hittable pitches—is more important than what you don’t—balls outside the zone—when the goal is improving quality of contact
- Balancing both is the best thing a hitter can do: that’s what SEAGER is
- Corey Seager is amazing
- There’s more work to be done in the future, like seeing if this can be tailored to a hitter’s unique strengths and weaknesses both in the zone and in terms of their power potential.
I’ll leave with this, which contains 2023’s SEAGER, Z-O Swing rates, and percentiles attached to each column. You can see, for example, that Jose Altuve went from a 7th percentile Z-O Swing rate to a 94th percentile showing in SEAGER. Or that the Rays jumped from 23rd in Z-O Swing as a team to 6th according to SEAGER.
Thank you for reading
This is a free article. If you enjoyed it, consider subscribing to Baseball Prospectus. Subscriptions support ongoing public baseball research and analysis in an increasingly proprietary environment.
Subscribe now
Instead of treating each as a percentage of times the right decision was made could you treat it as a cumulative stat adding or subtracting the predicted value of each swing/take decision to the player's ledger? And then convert to a rate stat by dividing by the number of decisions?