PECOTA projects Mike Trout (8.7 WARP) to be the best player in baseball this season, which is certainly no surprise. Trout has essentially been the best player in baseball since his rookie season in 2012, although every couple years another great player rises up to give him competition.
Mookie Betts did that last season, beating Trout for the MVP award during a spectacular year in which he hit .346/.438/.640 for a career-high 8.9 WARP. Trout hit .312/.460/.628, totaling 8.2 WARP. As you might expect, PECOTA projects Betts (7.5 WARP) to be the second-best player in baseball this season. No other player in either league is projected for more than 5.6 WARP. PECOTA clearly sees it as Trout, Betts, and the rest.
All of which got me thinking about how Trout and Betts compare to the best-projected players in PECOTA history, and about how the yearly progression of PECOTA’s best-projected players might provide an interesting glimpse into who’s dominated the game since BP’s projection system was created two decades ago.
Here are the no. 1 and no. 2 projected hitters each season since 2004, along with the combined projected WARP for the top two hitters that year:
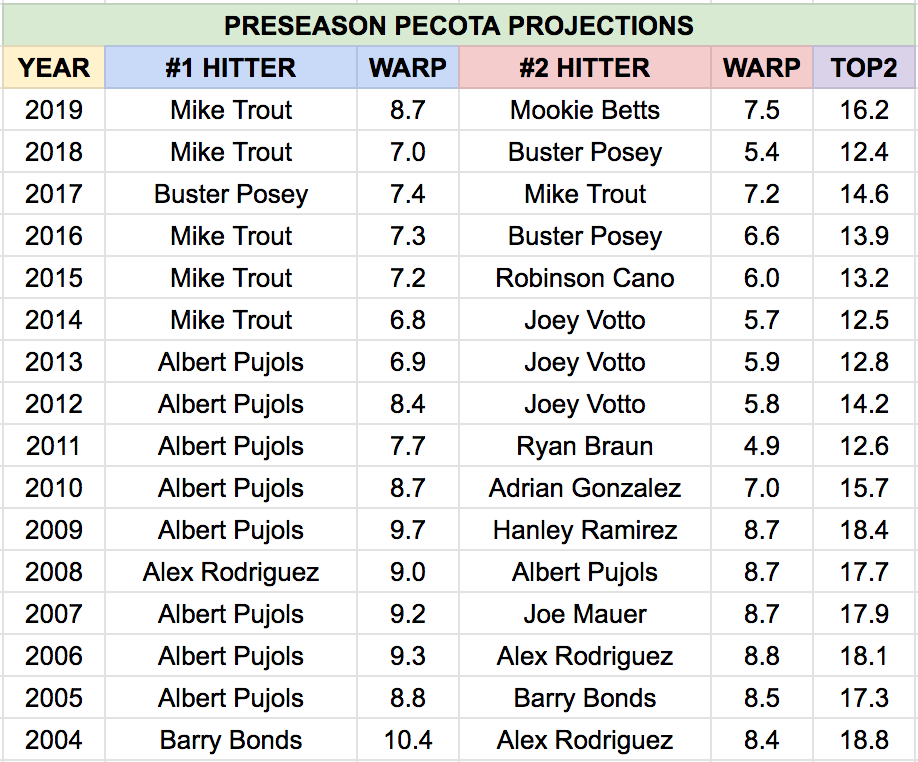
Buster Posey took over the top spot for 2017, pushing Trout to second place by 0.2 WARP. Alex Rodriguez took over the top spot for 2008, pushing Albert Pujols to second place by 0.3 WARP. And that’s all that kept either Pujols or Trout from being the best-projected hitter in baseball for 15 consecutive seasons.
Pujols was so consistently spectacular with the Cardinals that, even after a disappointing first season with the Angels in which his OPS was below .900 for the first time, PECOTA still projected him as the best hitter in baseball for 2013. He was far from that, hitting just .258/.330/.437 with 17 homers, and the next spring PECOTA projected Pujols as merely the 10th-best hitter (with his teammate, Trout, taking over the top spot). One year after that, Pujols was down to 21st and … well, you know what happened from there.
At first glance, it looks like the top hitters from the early days of PECOTA were simply better than the recent crop. However, while it’s true that the best-projected hitters from those early days—Pujols, Rodriguez, Barry Bonds—were amazing, another factor is that PECOTA grew more conservative as it aged. But now this year, as Rob Arthur wrote about last week, PECOTA has utilized better data and constant behind-the-scenes improvements to be “more aggressive about giving the best players their due.”
Not only is Trout’s projected 8.7 WARP this season the highest total for any hitter since Pujols in 2010, second-place Betts’ projected 7.5 WARP is the highest since Pujols in 2012. Just as the context of, say, hitting .300 or posting a 2.50 ERA has changed during different eras of baseball history, so too has the context of PECOTA projections. Of note, the largest gap between no.1 and no. 2 was Pujols over Ryan Braun in 2011 and Pujols over Joey Votto in 2012. And the smallest gap was the aforementioned Posey over Trout in 2017 and Rodriguez over Pujols in 2008.
Trout was projected for 40.6 WARP from 2011-2018 and actually produced 54.8 WARP, topping his projection in 2011, 2012, 2013, 2014, 2015, 2016, and 2018. He was hurt for two months in 2017, or he’d have surpassed his projection in every season of his career, which is why his impressive 8.7 WARP projection for 2019 is also about PECOTA realizing it can probably put a little extra faith in Trout in addition to simply feeling more comfortable with aggressive projections in general.
Bonds received the only double-digit WARP projection in PECOTA history in 2004 and then actually topped it, hitting an absurd .362/.609/.812 with 232 walks in 147 games for 11.4 WARP. He was also 39 years old that season, so PECOTA regressed him all the way down to a projected 8.5 WARP for 2005, a year in which he ended up being hurt for all but 14 games. And then Pujols took over.
Now let’s look at the best-projected pitchers in PECOTA history:
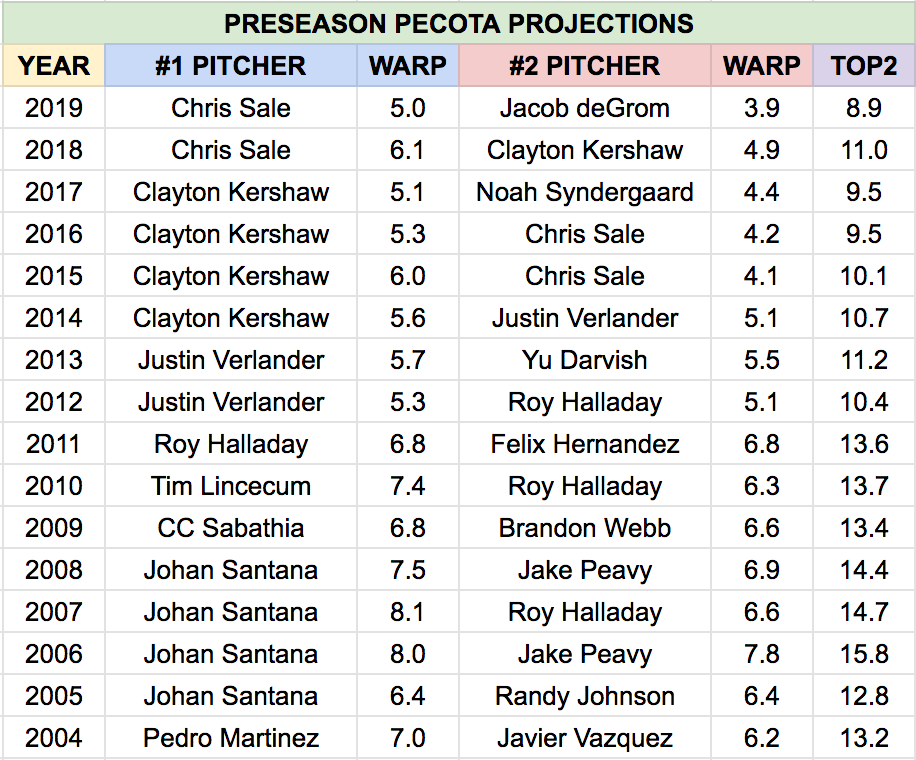
Like with the hitters, the highest projected WARP totals from pitchers were quite a bit bigger in the early days of PECOTA, Unlike with the hitters, that remains true even for this season, as Chris Sale‘s projected 5.0 WARP is the lowest total for a top pitcher ever and Jacob deGrom‘s projected 3.9 WARP is the lowest for a second-place pitcher.
Some of that is due to the way we’ve come to evaluate the relationship between pitching and defense, but it’s also due to simply projecting lower workloads now. Sale and deGrom are projected for 170 and 186 innings, respectively, and only one pitcher (Corey Kluber) is projected to reach 200 innings this season. Back in 2006, when Johan Santana and Jake Peavy combined for nearly twice as many projected WARP, they were also projected for 229 and 213 innings.
I’ve been known to use “don’t you think Santana was robbed of three straight Cy Youngs?” as an ice-breaker at parties, so I’m pleased to see that PECOTA projected him as baseball’s best pitcher in four straight seasons. Santana’s projected 8.0 WARP in 2006 and 8.1 WARP in 2007 are the highest by a pitcher in PECOTA history. There is no Trout- or Pujols-level dominance on the pitching side, with four straight best-projected seasons from Santana in 2005-2008 and Clayton Kershaw in 2014-2017 coming the closest.
I like the symmetry of PECOTA beginning in 2004 with an all-time great hitter (Bonds) and an all-time great pitcher (Pedro Martinez) grabbing the top spots late in their careers. Pujols has had a top-two hitting projection nine times, which is the most in PECOTA history, followed by Trout (6), Rodriguez (3), Posey (3), Votto (3), and Bonds (2). Kershaw leads all pitchers with five top-two projections, followed by Sale (4), Santana (4), Roy Halladay (4), Justin Verlander (3), and Peavy (2).
For full access to PECOTA’s player and team projections, including downloadable spreadsheets and detailed player cards, become a Baseball Prospectus subscriber today.
Thank you for reading
This is a free article. If you enjoyed it, consider subscribing to Baseball Prospectus. Subscriptions support ongoing public baseball research and analysis in an increasingly proprietary environment.
Subscribe now