This article is part of the launch for Baseball Prospectus’ new hitting statistic, Deserved Runs Created, which you can learn much more about here.

Throughout this past season, I wrote a week-by-week account of baseball a half-century ago. In American history, we remember 1968 as the year of the Tet Offensive, the King and Kennedy assassinations, the Chicago Democratic Convention riots, and the election of Richard Nixon. In baseball, it was the Year of the Pitcher, when Denny McLain won 31 games, Bob Gibson had a 1.12 ERA, and Don Drysdale pitched six straight shutouts.
It was a bad year for offense. Carl Yastrzemski led the American League with a .301 batting average, the only hitter to reach .300. The American League—the entire league—hit .230/.297/.339. That’s pretty much an entire league of 2018 Wilmer Difo, but worse.
But the + in DRC+ means the statistic is park- and league-adjusted. Whose bad statistics—everybody’s numbers were bad—were the best in the Year of the Pitcher?
This table lists the top 20 batting title qualifiers (21, actually, because there’s a tie for 20th), ranked by DRC+, with their slash statistics as well.
| Player | Team | Pos | DRC+ | AVG | OBP | SLG |
| Willie McCovey | SF | 1B | 175 | .293 | .378 | .545 |
| Carl Yastrzemski | BOS | LF | 166 | .301 | .426 | .495 |
| Ken Harrelson | BOS | RF | 162 | .275 | .356 | .518 |
| Frank Howard | WAS | LF | 159 | .274 | .338 | .552 |
| Willie Horton | DET | LF | 157 | .285 | .352 | .543 |
| Hank Aaron | ATL | RF | 156 | .287 | .354 | .498 |
| Willie Mays | SF | CF | 155 | .289 | .372 | .488 |
| Bill Freehan | DET | C | 153 | .263 | .366 | .454 |
| Dick Allen | PHI | LF | 151 | .263 | .352 | .520 |
| Jimmy Wynn | HOU | CF | 148 | .269 | .376 | .474 |
| Ron Santo | CHN | 3B | 145 | .246 | .354 | .421 |
| Tony Oliva | MIN | RF | 145 | .289 | .357 | .477 |
| Frank Robinson | BAL | RF | 144 | .268 | .390 | .444 |
| Billy Williams | CHN | LF | 143 | .288 | .336 | .500 |
| Ernie Banks | CHN | 1B | 140 | .246 | .287 | .469 |
| Mickey Mantle | NYA | 1B | 140 | .237 | .385 | .398 |
| Pete Rose | CIN | RF | 139 | .335 | .391 | .470 |
| Lee May | CIN | 1B | 136 | .290 | .337 | .469 |
| Tony Perez | CIN | 3B | 132 | .282 | .338 | .430 |
| Reggie Smith | BOS | CF | 131 | .265 | .342 | .430 |
| Bob Allison | MIN | LF | 131 | .247 | .324 | .456 |
***
Ernie Banks. Mr. Cub was clearly on the downside of his Hall of Fame career. He was 37 in 1968, and though he hit 32 homers, he had the worst full-season batting average and on-base percentage, and the second-worst full-season OPS, of his career. Yet his DRC+ is the same as Edgar Martinez’s .324/.423/.579 in 2000. That’s not a surprise, given what we’ve learned about park- and league-adjusted figures; there were over 50 percent more runs scored per game in 2000 than in 1968. But Banks did much better per DRC+ than per OPS+ (118) and wRC+ (123), because DRC+ sees him as deserving 18 more singles than he was given credit for, reflective, in part, of a .229 BABIP that was the fourth-lowest among 90 MLB batting title qualifiers.
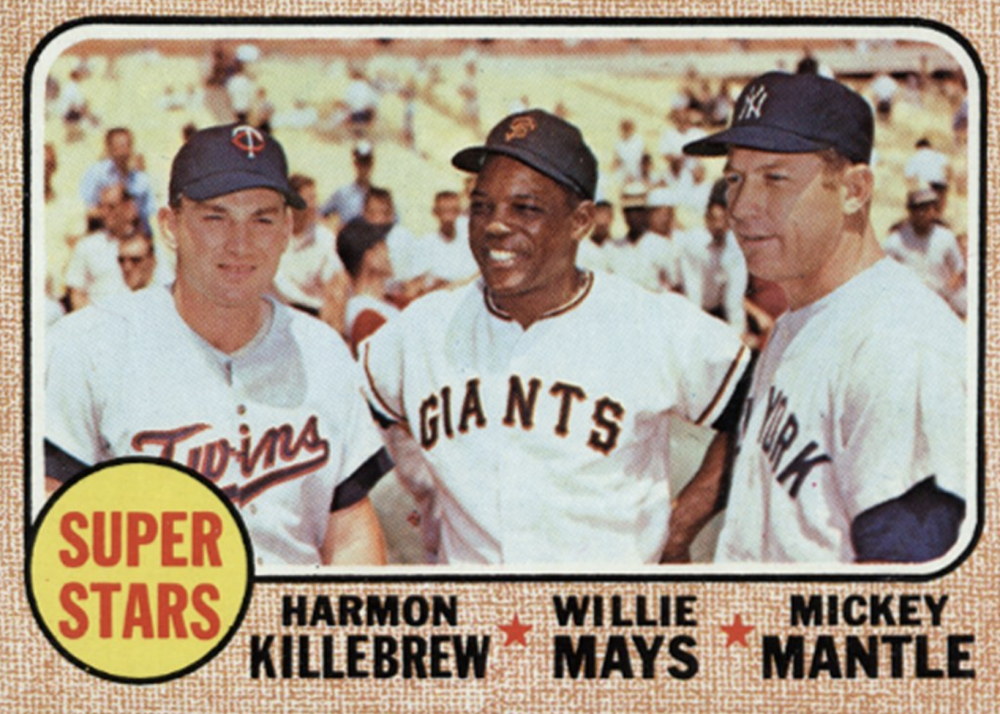
Mickey Mantle. The Hall of Famer’s last season was widely viewed as a sad swan song. It was the only time in his career that his batting average was below .245 or his slugging percentage under .430. In fact, he’d entered the season with a career .302 batting average; his .237 in 1968 dragged his lifetime figure below .300, to .298. He hit 18 homers, the only season in which he qualified for the batting title and hit fewer than 20, and he went deep in only 3.3 percent of his plate appearances, the lowest proportion of his career. And he was a first baseman, his knees having forced him off center field, where he’d starred.
Yet there he is, the eighth-best hitter in the American League per DRC+. Why? Context. Mantle’s season was a disappointment in relation to the numbers to which we’ve become familiar, and in relation to his own lofty record. But he was good. He hit .237/.385/.398 in a league that hit .230/.297/.339.
He was second in the league in walks and, as a result, third in on-base percentage. He was one of only 11 major-league batting title qualifiers to walk more often than they struck out. He was one of only eight American Leaguers to hit a home run more frequently than once every 25 at-bats. Despite his aching wheels, he was 14th in the AL at avoiding double plays, just ahead of Baltimore’s speedy Don Buford. He wasn’t good compared to, say, turn of the millennium first basemen or peak Mickey Mantle. But he was good.
Harmon Killebrew. The 1968 season was a lost one for Killebrew. He was voted to start the All-Star game at first base despite hitting .204/.347/.392 with only 13 homers heading into the game. Then, in the game, he tore his hamstring reaching for a throw. Out until September, he was more like himself upon his return (.257/.458/.629), but his overall line, .210/.361/.420, gave him his lowest OPS by nearly 100 points since becoming a regular in 1959.
He didn’t bat enough to appear in the table above, but his DRC+ was 150, right between Dick Allen and Jimmy Wynn. That made him and his .782 OPS the fifth-best hitter in the league, behind only Yastrzemski (.922), Ken Harrelson (.874), Frank Howard (.890), and Willie Horton (.895). What made him that good?
Well, he walked a lot—18.9 percent of his plate appearances, second only to Mantle’s 19.4 among players with at least 300 plate appearances. Killebrew homered once every 17.4 at-bats, the eighth-most frequently in the majors. And he was, ahead of his time, a Three True Outcomes player, with 42 percent of his plate appearances ending in a strikeout, walk, or home run, the most in the league.
That meant he made relatively few outs on balls in play (despite a .212 BABIP), resulting in a positive 8.1 contribution from Out Runs, eighth in the league despite only 371 plate appearances. All his walks gave him 7.0 NIP (not in play) Runs, and Killebrew’s homers helped generate 6.0 Hit Runs. He was one of only 19 AL batters to have a positive score for all three. And that .212 BABIP, DRC+ estimates, cost him 10 singles and three doubles that he deserved.
His 150 DRC+ wasn’t great by his standards—in the 10 years from 1961 to 1970, he exceeded it every year but 1962, when he had 146—but Killebrew’s standards weren’t 1968’s standards.
Cardinals hitters. Bob Gibson was the National League MVP, but several teammates were in the running as well. Center fielder Curt Flood was fourth, left fielder Lou Brock was sixth, third baseman Mike Shannon was seventh, and shortstop Dal Maxvill was tied for 20th.
The pennant-winning Redbirds were the class of the NL. They held their opponents to fewer than three runs per game, ranking first, second, and fourth, respectively, in ERA, FIP, and DRA. They had the second-best park-adjusted defensive efficiency. But their offense wasn’t noteworthy, as they scored 3.60 runs per game, just a bit above the league average of 3.43.
And none of their hitters stand out, despite their MVP vote rankings. Flood hit .301 but with no power and, per FRAA, a down year with the glove. His DRC+ was 100. Brock hit .279 and led the league with 62 stolen bases but rarely walked; his DRC+ was 106. Shannon was at 103. Maxvill, oddly, set career-highs in 1968 for all three slash statistics (.253/.329/.298—yes, .298 slugging was his best in a 14-year career) but that still translated to a 93.
Nobody else was notable, either: Catcher Tim McCarver 99, first baseman and defending MVP Orlando Cepeda 114, second baseman Julian Javier 85, right fielder Roger Maris 108. There were no weak links on the team. But nobody hit anywhere near as well as Allen, Wynn, or Lee May, to name three on the table above who received no MVP consideration.
Roberto Clemente. The Pirates great had an outstanding season, hitting .291/.355/.482, giving him a 129 DRC+ that just misses the top 20 listed above. Yet the other rating systems viewed him as even better. He had a 152 OPS+, tying him for 11th in the majors, and his 145 wRC+ is tied for 13th. His .312 BABIP was the 14th-highest in the majors during a year in which the average BABIP was .269. As a result, DRC+ sees him as deserving of 14 fewer singles, two fewer doubles, six fewer triples, four fewer homers, and five fewer walks than he received. That he could be the beneficiary of such good fortune and still deserve to be a top-25 hitter speaks to his excellence.
***
Again, we don’t need DRC+ to tell us that batting statistics in 1968 were outliers, any more than we need advanced statistics to tell us that Gibson’s ERA or McLain’s win total were also outliers. The value is in expanding our knowledge to what we don’t know: That Mantle and Killebrew were, in fact, excellent hitters in 1968, that the Cardinals weren’t, and that Banks and Clemente’s seasons fit well into Hall of Fame résumés despite posting numbers worse and better, respectively, than they deserved. Based on what DRC+ has illuminated about baseball 50 years ago, I look forward to learning more. I hope you do, too.
Thank you for reading
This is a free article. If you enjoyed it, consider subscribing to Baseball Prospectus. Subscriptions support ongoing public baseball research and analysis in an increasingly proprietary environment.
Subscribe now
I'm wondering:
--Does the DRC+ adjustment consider speed of player, i.e., a slow runner's BABIP being low might not be bad luck but caused by that slow speed (and vice versa for faster runner)?
--Does the DRC+ adjustment consider shift-susceptibility of player, i.e., a strict pull hitter's BABIP being low might not be bad luck but caused by his "hitting where they are"
(and vice versa for someone who hits all over the place)?
Gil Traub