
I’m assuming that since this is Baseball Prospectus, I can skip over the argument about how Jacob deGrom’s 10-9 record is irrelevant. In a year filled with fun facts about just how bad deGrom’s luck had been, the best summation I saw came from Mets beat writer Tim Britton of The Athletic, who framed it thusly:
Sean Newcomb is done after five scoreless. The 32 opposing starters against Jacob deGrom this year combined for a 2.45 ERA in 173 innings. The only National League pitcher with a better ERA is Jacob deGrom.
— Tim Britton (@TimBritton) September 27, 2018
While deGrom’s talents won’t be on display in the playoffs, he can at least look forward to taking home some hardware in the offseason and a nice paycheck when he gets to the arbiter’s office. deGrom should have his name carved into the NL Cy Young trophy, in a reasonably close race with Max Scherzer and Aaron Nola. However, with apologies to the magnificent Christian Yelich and the “pitchers already have their own award” crowd (of which I consider myself a member), deGrom should also take his rightful place as the NL Most Valuable Player.
The deGrom-Yelich debate will probably merit a few columns once the World Series is over, for the same reason that we all write “my fake ballot” columns: there’s nothing else to write about then. In generations previous, writers might have looked at deGrom’s pitching brilliance and Yelich’s flirtation with a Triple Crown and shrugged about how to compare the two. While pitchers are (and always have been) technically eligible to win the MVP, over the last 30 years only three have (1992 Dennis Eckersley, 2011 Justin Verlander, and 2014 Clayton Kershaw). The MVP has mostly functioned as the “best position player” award.
Unlike previous MVP scuffles, like the 2012 American League version which pitted Triple Crown-winning Miguel Cabrera against WAR(P) leader Mike Trout, Yelich’s candidacy is rock solid among both the “traditional” stats and the “new age” stats. He led the NL in WAR among position players, and in slugging percentage and OPS. But a quick glance at the WAR leaderboards shows that while he had an excellent year, he’s still running a bit behind deGrom.
| WAR version | Yelich | deGrom |
| Baseball Prospectus | 7.5 | 8.1 |
| FanGraphs | 7.6 | 8.8 |
| Baseball Reference | 7.6 | 10.0 |
Unlike the 2012 Cabrera/Trout debate, where the WAR leaderboards had them separated by about three lengths, Yelich is at least within shouting distance of deGrom. There’s even a case to be made—and I’ve made it in the past for Mookie Betts—that the fact Yelich can play a minimally decent center field is worth something, even if he didn’t actually do it very often. Since he was teammates with Lorenzo Cain this year, he didn’t need to, but last season Yelich played center field full time for the Marlins and did OK. In theory, the fact that Yelich could slide over to center field meant that the Brewers could keep a fourth outfielder like Domingo Santana on their roster, despite Santana being more of a corner guy.
If Yelich doesn’t have a center field glove, they might have instead kept an all-glove-no-hit guy like Keon Broxton on the roster. Had Yelich gone down with an injury, the Brewers likely would have had to replace him with someone who could “handle center” (Broxton), so is it fair to set his comparison group as corner outfield backups rather than the somewhat more forgiving center field bin? WAR doesn’t know that he can play center field, though, and it docks him accordingly. One could make the case that WAR should inch Yelich ahead by a bit to where he’s more or less tied with deGrom, at least to the point where a vote for either man wouldn’t be silly.
Here’s the dramatic turn: I think WAR is underrating deGrom a bit. Really.
Warning! Gory Mathematical Details Ahead!
This season there were 13 pitchers who threw at least 200 innings (deGrom threw 217, second-most behind Max Scherzer’s 220 2/3). In 2008, there were 34 such pitchers. In 1998, there were 56. Lamenting the withering away of the 200-inning pitcher is well-trodden ground. While “share the work” arrangements might be the new rage and managers appear to be making rather unorthodox pitching assignments with the dread of the “third time through the order” penalty on their mind, it means there’s now even more value in a pitcher who can go through the opposing lineup three times and be effective enough to not need a replacement.
In 2010, BP alumnus Colin Wyers wrote an article which has never fully gotten its due, despite its elegance. In it, he looked at the historical record (he used data from 2003-2009) which showed that when a starting pitcher went deeper into a game, the relievers that followed him gave up runs at a lower rate than when the starting pitcher didn’t go as deep. It’s not rocket science to figure out why that happens. When a starter gives a team five innings, his manager knows that he’ll need four from the ‘pen. When a starter makes it through seven innings, his manager only needs two from the reserves. In the latter case, the manager tells the two mediocre relievers who would have pitched the sixth and seventh innings to go watch The Marvelous Mrs. Maisel and to let the good relievers handle things.
Using data from 2013-2017, let’s update Colin’s work and show what the average bullpen RA9 (runs—whether earned or unearned—was based on how long the starter pitched). I censored the end at 24 outs (eight innings) because the sample size of pitchers who went into the ninth inning was low, and caused some weird gyrations at the end.
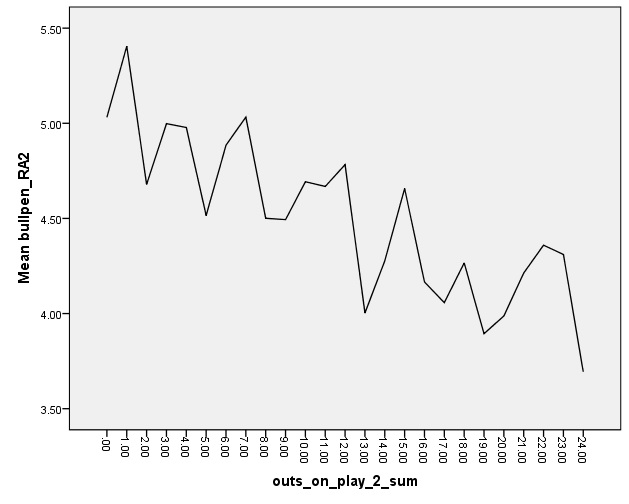
As expected, we see a nice downward trend. The longer the starter goes, the better the bullpen does, likely because of who doesn’t pitch as a result. (Maybe the relievers who do pitch realize they can give a more “max effort” performance because they don’t have to worry about providing bulk innings or maybe a manager is more comfortable playing matchups and burning a reliever for one batter.) In any case, the fact that the starter went deep into the game has repercussions beyond the point where his manager comes out to take the ball from him, but that can be directly attributed to him. WAR doesn’t take that into account.
In general, WAR looks at the value that a pitcher provided while he was on the mound, and compares it to some baseline level. WAR sees what deGrom did in the sixth inning, but doesn’t have a way of appreciating the fact that he’s still out there in the sixth inning.
We can run a regression line through the graph above and come up with an equation for the “expected” bullpen RA9 for the rest of the day based on how many outs the starter records.
5.14 – 0.049 * outs by starter
Every out that the starter records drops the bullpen RA9 by about .05 runs. In 2018, relievers gave up 8,579 runs in 17,422 innings, for an RA9 of 4.43. It means that if a starter makes it through the fifth inning, the expected bullpen RA for the rest of the day is (just a tick below) average. If he can make it to the end of the sixth, it’s lower still.
(Note: I’m mixing data from different years out of convenience for the moment, and I’m aware that in 2018 #TheOpener became “a thing” and that some of the “relief” appearances in the 2018 data sets were actually the bulk-out-getter who just happened to be the second pitcher on call that day rather than the first. This model will need some refinement.)
In true WAR fashion, we want to be careful to only credit a player for what he can control and not what he can’t. The Mets’ bullpen woes were widely known (Paul Sewald, come on down!) and so deGrom can’t be held responsible for what the Mets actually ended up doing once he left the game. WAR currently solves this problem by ignoring what happens after he leaves. However, we can pull WAR’s favorite trick and de-contextualize everything (which is sometimes a bug, and sometimes a feature) and assume that what should have followed deGrom (or any pitcher) would have been league-average relief (RA9 of 4.43). However, we also know that average moves with how long he remains in the game and by remaining in the game longer, he creates extra value for his team.
I propose that deGrom (or any starter) should collect that value. The value could be calculated fairly easily. By reaching the 21st out, deGrom would have made a league-average bullpen about 0.30 points of RA9 “better” for the two innings that they will need to pitch. The amount of “extra value” that he gains by pitching deep into the game can be given then by the formula:
((League Average Relief RA9; 4.43) – (5.14 – 0.049 * outs by starter)) / 27 * (27 – outs by starter)
The tricky part here is that sometimes a manager will leave a starter in because he’s afraid of what horrors might emerge if he dares to open the bullpen door. The fact that the starter went seven innings is less a credit to him and more an indictment of the bullpen. While this does happen, WAR would handle this by assuming that if the starter is in there because he’s the best of several bad options, he’ll probably pitch like it. WAR will debit him for poor performance. It’s probably not fair to him because, on a league-average team, he might have already been out of the game ad not given up that two-run homer. However, he will pick up a bit of credit from this formula, perhaps restoring order to the universe.
Before we go any further, there’s another nice effect of a pitcher going deep into a game. With a lighter workload tonight, the bullpen is fresher for tomorrow night. I looked to see whether the number of outs recorded by the previous game’s starter made a difference for their bullpen performance, once we controlled for how many outs the current game’s starter got. Sure enough, the effect of the previous game’s starter was significant (barely, p = .046).
The regression equation was:
5.55 – .056 * outs by today’s starter – .018 * outs by previous game’s starter
(I ran a second regression in which I looked at whether the “next game” was the next day or not, and got much the same results.)
In 2018, the average starter recorded 16.08 outs, meaning the bullpen picked up 10.92 outs in a nine-inning, 27-out game. We’ll assume that in our context-neutral world, deGrom’s Mets ran a league-average starter out there the next day, and put 16.08 into the regression above, meaning that tomorrow’s anticipated bullpen RA9, as a function of what deGrom did the day before, is:
4.65 – .018 * outs by previous game’s starter
The amount of value that he provides denominated in runs can then be given as:
((League Average Relief RA9; 4.43) – (4.65 – .018 * outs by previous game’s starter)) / 27 * 10.92
We can now use deGrom’s actual game log to get an idea of how much extra value he really provided. Here’s March, April, and May:
| Date | Outs Recorded | Same-Day Value | Next-Day Value |
| 3/31 | 17 | 0.046 | 0.035 |
| 4/5 | 18 | 0.057 | 0.042 |
| 4/10 | 18 | 0.057 | 0.042 |
| 4/16 | 22 | 0.068 | 0.071 |
| 4/21 | 21 | 0.071 | 0.064 |
| 4/27 | 22 | 0.068 | 0.071 |
| 5/2 | 12 | -0.068 | -0.002 |
| 5/13 | 3 | -0.500 | -0.067 |
| 5/18 | 21 | 0.071 | 0.064 |
| 5/23 | 21 | 0.071 | 0.064 |
| 5/28 | 21 | 0.071 | 0.064 |
We see that when deGrom only lasted one inning on May 13, it was a big hit to the Mets because generally teams have to bring in their awful long reliever in those situations and it tires out the bullpen for the next day. However, because deGrom specialized in going deep into games on a consistent basis, there were a lot of positives in his account. Over the course of the 2018 season, using this methodology, he provided 1.21 runs of value based on making sure that the bullpen didn’t have to do as much on the day he pitched and 1.89 runs based on the bullpen being more rested the next day.
That’s about three runs worth of value for which WAR has no accounting. The preceding exercise is a bit of slap-dash methodology, but that’s the correct order of magnitude for the answer. A pitcher who regularly goes deep into the game—the sort of pitcher who gets to 200 innings—is worth a few extra runs thanks to his workhorse-itude. That’s not a game-changing amount, but we’re now “one-third of a win” territory.
In the past, I’ve made the case that the job description we once knew as “starting pitcher” is beginning to split into two distinct jobs. There are Tutos and there are Threetos. Tutos are most likely to go two times through the order. Threetos are the “classic starter” tasked with three trips around the block. Teams have realized that if there aren’t 150 guys in the league capable of handling five starting spots on 30 teams, why not build a staff around what pitchers are actually good at? It means surrendering some amount of value by increasing the workload on the bullpen, but up until this point, there’s not really been a lot of investigation as to how much value that really is.
Now we know, and the implications are that the 200-inning starter might end up being a thing of the past. If teams can get more value by asking pitchers to concentrate on what they’re actually good at rather than forcing them to try to fit a pre-defined role, the barrier they have to clear for that trade-off to be a net positive isn’t all that high. There is value in being a workhorse, but not oodles of it.
Thank you for reading
This is a free article. If you enjoyed it, consider subscribing to Baseball Prospectus. Subscriptions support ongoing public baseball research and analysis in an increasingly proprietary environment.
Subscribe now