This article was originally published on September 20.
I recently completed a four-part series on starting pitching. In it, I noted that starting pitchers are pitching fewer innings per start, with more rest between starts, and that those trends seem inexorable. As a result, the value of starting pitchers is being shifted to ever-larger bullpens. That results in several changes to the game including, I posited, compensation.
But is that true?
Fortunately, with the fantastic tool of Cot’s Contracts, we can check this. I looked at Opening Day payrolls since 2003. That’s not a perfect measure, since payrolls at any time include both teams’ active roster (25 through 2019, 26 starting this year) and anyone on the injured list. If a team has a number of players injured on Opening Day, its payroll may be higher than it is at a subsequent date when the injured players return and their replacements are removed from the roster. But it’s really the best we can do. It’s a fool’s errand to figure out who on the Astros, for example, is replacing Justin Verlander, and it also doesn’t make sense to remove Verlander’s $33 million 2021 salary for the entire year.
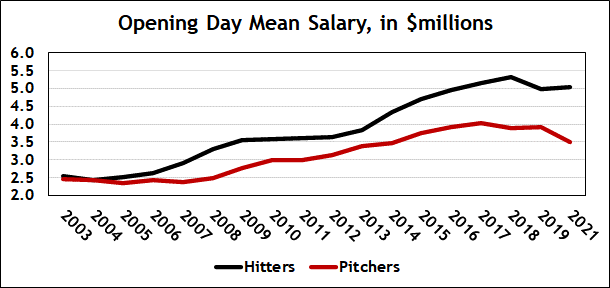
Here’s the breakdown between hitters and pitchers, as well as total MLB payrolls. I’m going to display this on a per-team basis. In all cases, I’ve excluded 2020.
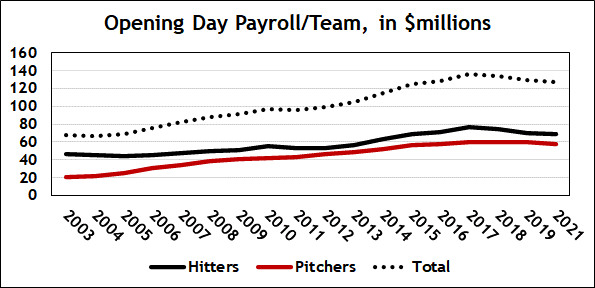
You can see why the Players’ Association is concerned. Opening Day payrolls peaked in 2017, at $136 million per team. They’ve been in decline since. This year, they were at $127 million, a 7 percent decline since 2017, despite the addition of an extra roster spot. (Were all things equal, payrolls would have increased by four percent, reflecting the four percent expansion of rosters.)
But rather than focus on the dotted line representing total payrolls, look at the black line for hitters and red line for pitchers. My thesis was that more pitchers = lower payrolls. That doesn’t appear to be happening. Since 2012, for every dollar teams have spent on hitters, they’ve spent about $0.83 on pitchers. That hasn’t changed.
Ah, but the composition of rosters has shifted.
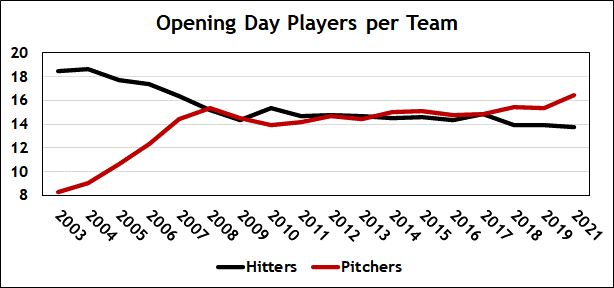
Players on the IL muddy this analysis somewhat. There were 802 players on Opening Day rosters in 2003 and 905, 13 percent more, in 2020. But the figure’s been stable over the last decade. From 2012 to 2021, teams have averaged between 29.0 and 30.2 players rostered on Opening Day. That’s not a lot of variance.
What has changed, though, is the composition of those rosters. As recently as 2013, teams’ Opening Day rosters had more hitters than pitchers. In 2017, there were exactly 446 of each. This year, there were 20 percent more pitchers than hitters. That’s unprecedented.
If there are more pitchers relative to hitters, and salaries for pitchers and hitters don’t change, we’d expect pitchers to earn an increasing share of overall payrolls. They aren’t.
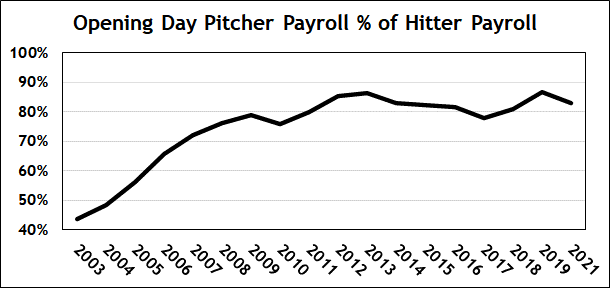
For a few years, pitchers’ proportion of payrolls tracked with the red line, showing total pitchers on Opening Day payrolls, in the previous graph. But now they’ve flattened out. And you can probably guess why.
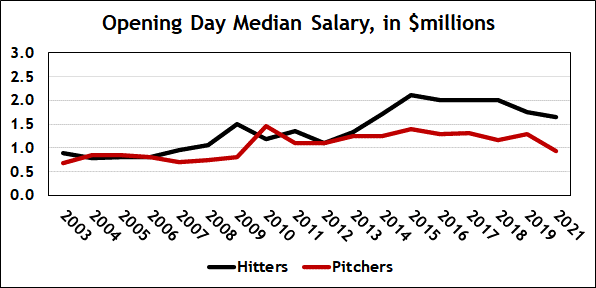
Salary growth for all players has stalled, but it has moreso for pitchers. This year’s median pitcher salary, $925,000, is the lowest it’s been since 2009.
Last graph. Here’s how pitcher salaries have tracked hitter salaries.
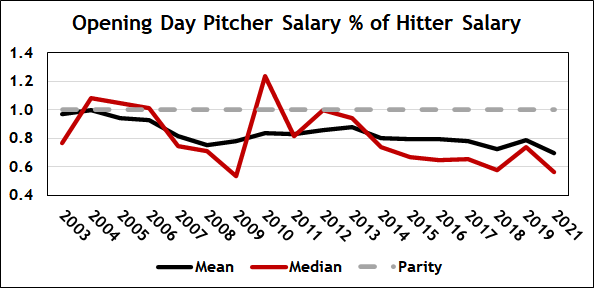
The median data are a little noisy, as you can see. But the general trend is obvious. Early in this century, pitchers made almost as much as hitters. Now they make a good deal less, and the gap’s been gradually widening.
I think there are two clear takeaways. The first is that the expansion of pitching staffs is a major contributor to the dampening of overall MLB payrolls. This is for two reasons. The first is that pitchers, in general, make less than hitters. The second is that, as I pointed out in the last article in the series, the value individual pitchers comprise to team wins is in decline. Starting pitchers are throwing fewer innings—18 pitchers logged at least 220 innings in 2011, which is 18 more than we’re on pace for this year—which limits their contribution. And reliever workloads are not correspondingly increasing. They are in aggregate, but not for individual relievers. Relievers in 2011 averaged 1.02 innings per appearance, and that’s risen only to 1.09 this year. If a pitcher has less of a role in his team’s wins, it logically follows that he should be paid less. As a result, we get more pitchers, with those pitchers making, in aggregate, less money.
The second takeaway is that this is, it seems to me, a byproduct of modern strategy rather than a plot to pay players less. Yes, reducing pitcher workload leads to more pitchers on rosters, who make less money than hitters anyway. It also yields less money paid to individual pitchers, since they shoulder less of the responsibility for team wins. As a result, player compensation goes down and team profitability goes up.
But this strategy also leads to better outcomes. The times-through-the-order penalty for starters and the impact of heavier workloads on relievers is well-understood. A win-maximizing strategy involves doling out innings to an increasing number of pitchers. For front offices, the resulting effect on payrolls is—what’s the opposite of collateral damage, collateral benefit? Is that a thing? Anyway, it’s happening. (And this is where, for the umpteenth time, I propose limiting the size of pitching staffs.)
Thanks to Jeff Euston for creating Cot’s Contracts and providing aggregate data for this report.
Thank you for reading
This is a free article. If you enjoyed it, consider subscribing to Baseball Prospectus. Subscriptions support ongoing public baseball research and analysis in an increasingly proprietary environment.
Subscribe now