This concept was originally presented at a SABR conference in March 2022 and has been adapted for publication at Baseball Prospectus.
In our previous article, we discussed the development of the EAGLE metric through an approach quantifying the expected change in run expectancy for each swing/take decision. In this article, we describe its performance at predicting performance and evaluate hitters with it. First, we can see that EAGLE correlates well with common plate discipline metrics like O% and BB% in the graphs below.
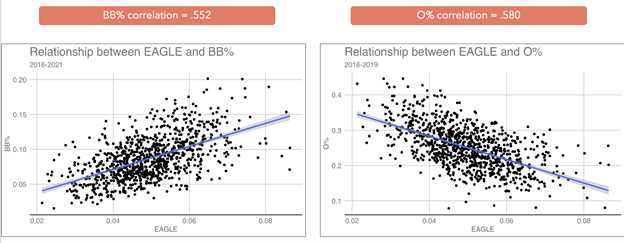
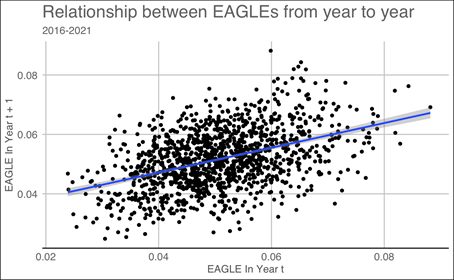
These relationships are a good sign because they tell us that EAGLE really measures something, that we have created a metric that measures a player’s ability to make decisions at the plate. Another feature of a well performing metric is stability from year to year, indicating it measures a true player characteristic rather than simply reflecting noise. This is especially important for a plate discipline metric because we would expect a player’s decision making ability to be relatively constant throughout from year to year. Unless a player makes a significant change to their approach at the plate, EAGLE should stay relatively stable over time. We show here that EAGLE is stable with a correlation of .452 from year to year.
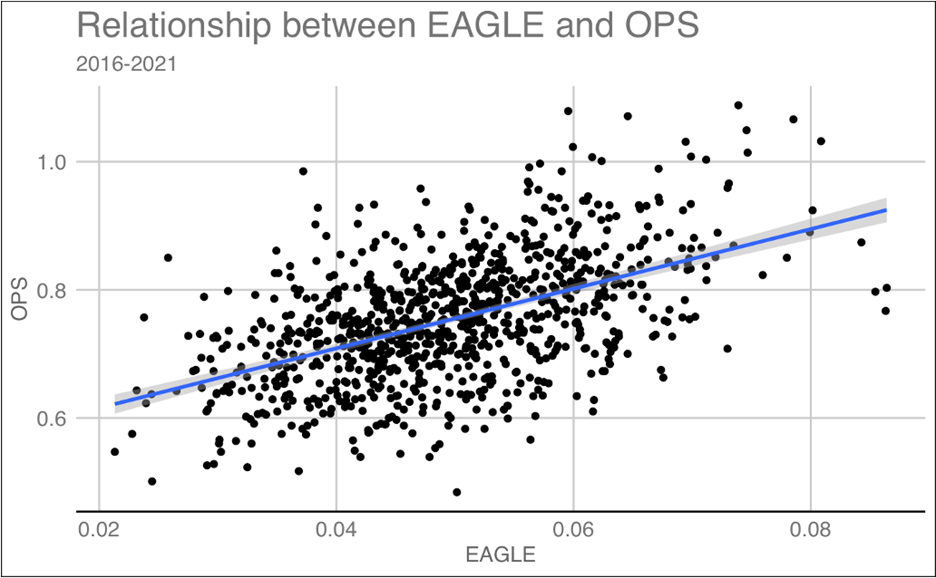
While EAGLE captures traditional plate discipline concepts, its true strength is how it measures the full range of outcomes from each decision to swing or not to swing. In doing this, EAGLE takes into account the slugging aspect of baseball as well, by predicting what pitches are likely to be hit for extra bases. As shown below, EAGLE has a strong relationship with On-base Plus Slugging (OPS) with a correlation of .508. No other plate discipline statistics take this aspect of baseball into account. Chase rate only has a correlation with OPS of -.104.
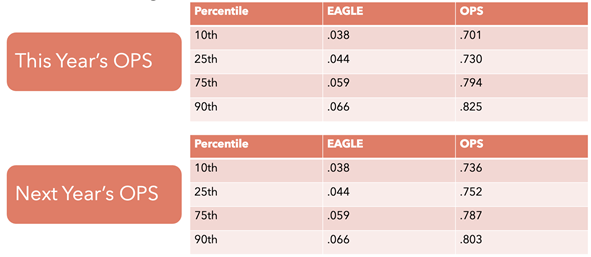
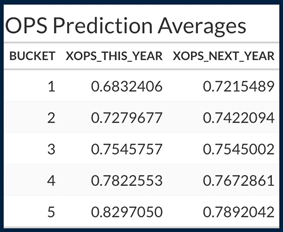
EAGLE can also not only be used to explain the current season’s OPS, but to predict next year’s OPS as well, showing the predictive power that this metric has. Below is a table of percentiles and their EAGLE as well as their corresponding OPS predictions. There is a significant difference between the higher and lower percentiles in predicted OPS and shows that EAGLE can discriminate between good and bad hitters both now and in the future. Additionally below shows a table split up by sections of 20% of hitters in EAGLE and their average predicted OPS for this year and for next year to show that these predictions work when applied to hitters. Bucket 1 is the bottom 20% of hitters in EAGLE and bucket 5 is the top 20% of hitters in EAGLE.
Now after proving EAGLE is a new and innovative metric, we can now use it to see which hitters are actually the best at making decisions at the plate. Below is a table of the best and worst hitting seasons in terms of EAGLE over the past five years. To be more clear, these are the runs generated per pitch by the hitter’s decisions.
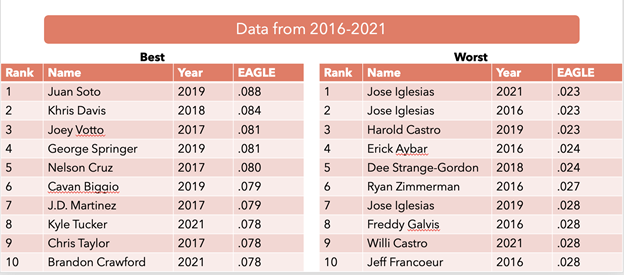
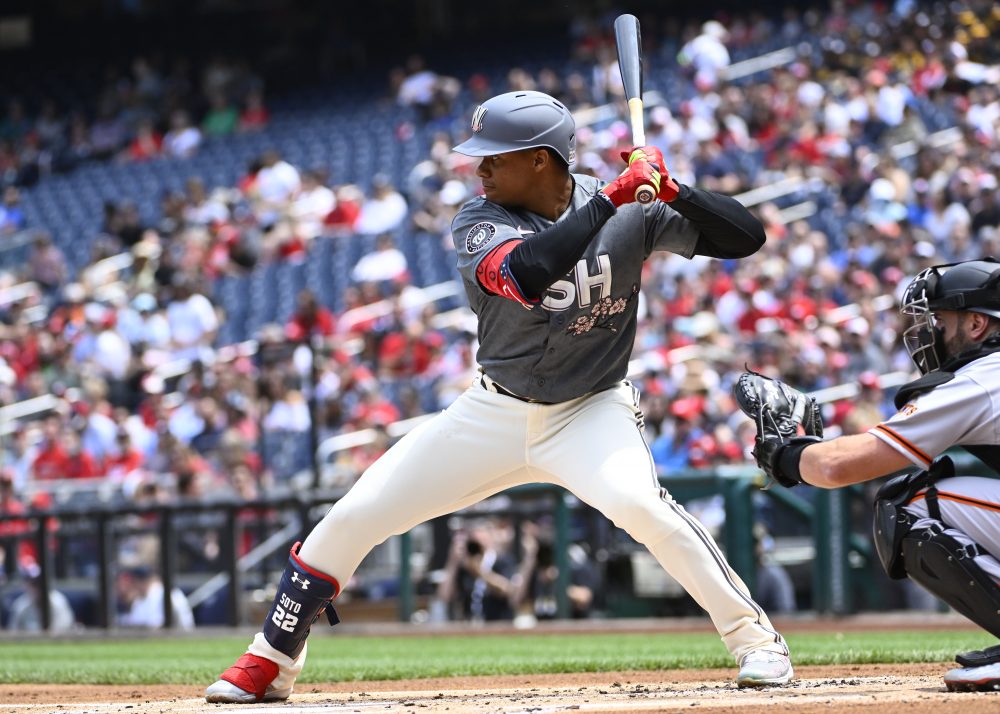
Some of the players commonly perceived as plate discipline greats are at the top here like Joey Votto and Juan Soto and some of the more free swingers and aggressive hitters are towards the bottom like Jose Iglesias and Dee Strange-Gordon. Now we’ve seen how EAGLE can be aggregated, but what’s also useful about EAGLE is that it can be applied on a pitch by pitch level, so let’s take a look at a few instances here.
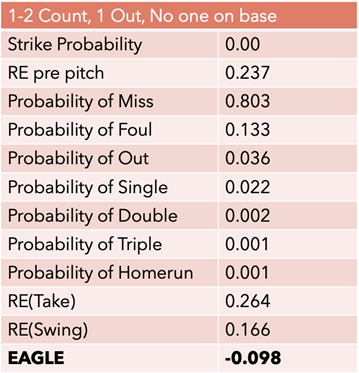
Here is a swing that many baseball fans have probably seen cross their social media feeds. This is Anthony Santander swinging at a Charlie Morton curveball that manages to go through his legs. Obviously a bad decision, and EAGLE will tell you that this swing was worth -.098 runs due to the probability of a swing and miss on this pitch being .803. The table below breaks down the EAGLE estimate for this pitch. The predicted probabilities as well as the run expectancies pre-pitch are given, everything needed to calculate EAGLE except for the run expectancies of each outcome.
And as you can tell, nothing good was going to happen on this pitch, an obviously bad decision to swing. Let’s take a look at a more high stakes situation. This decision to swing by Byron Buxton with the bases loaded cost the Twins -.910 runs, a much more costly decision because of the situation. This is clearly a bad pitch outside of the strike zone and results in a swing and miss probability of .857.
These next two examples are not swings and misses. Although this next pitch is the most costly of all three we’ve seen so far. Austin Hedges decides to take strike three right down the middle of the plate in a bases loaded situation for the third out of the inning. Clearly a terrible decision and it costs his team about -1.659 runs. If he had swung, we estimate a 10.1% chance of a home run.
This final example is Seattle catcher Tom Murphy. He swings at a pitch right down the middle and cranks it down the left field line just barely to the left of the foul pole. As a fan, you’re upset that it’s just a foul ball, but Murphy should be rewarded for his decision to swing here. With a .453 probability of a homerun on this pitch his decision to swing added a predicted .953 runs.
This ends the EAGLE saga and you can check out the EAGLE app here which contains 2019 EAGLE data. The next thing we’ve done with EAGLE is investigate its use for pitchers. This tells how good pitchers are at being deceptive, or causing hitters to make the wrong decision. We’ve broken down pitching performance into stuff, control, and EAGLE to predict and explain overall pitching performance and we’ve encapsulated that into this brand new app which includes a 2022 feature page that’s updated everyday and includes running hitter EAGLEs for 2022 as well. There’s plenty more investigating to do into the uses of EAGLE so stay tuned for more updates.
Joshua Mould is a Junior at Villanova University studying Computer Science and Statistics and will be an Associate Quantitative Analyst this summer with the Philadelphia Phillies
David Anderson is the Michele and Christopher Iannaccone ‘91 Assistant Professor of Analytics at the Villanova School of Business
Thank you for reading
This is a free article. If you enjoyed it, consider subscribing to Baseball Prospectus. Subscriptions support ongoing public baseball research and analysis in an increasingly proprietary environment.
Subscribe now