This concept was originally presented at a SABR conference in March 2022 and has been adapted for publication at Baseball Prospectus. Part 2 will follow tomorrow.
Plate discipline is an aspect of baseball that has continued to be investigated as an important part of hitting performance. In this piece, we describe a new metric Expected Additional runs Gained by Looking/swinging Estimate (EAGLE) developed to accurately quantify how good a player is at making decisions at the plate. The plate discipline revolution started when the realization that taking walks can contribute greatly to run scoring helped launch the Moneyball era. In 2002, the Oakland Athletics discovered this phenomenon and discovered that there were a significant number of baseball players who were undervalued because of some attributes like age, ability to throw, or lack of speed. Ultimately, these characteristics didn’t cover the entirety of the reasons these players were undervalued. Baseball since its inception has always valued players who could hit the ball more than players who couldn’t and it was pretty much that simple. Now, we know better.
Baseball analytics have advanced to the point where we value walk rates and chase rates highly and look at in-zone and out-of-zone swing and contact rates as well to determine how good a player is at “plate discipline.” But, plate discipline is more than simply drawing walks and avoiding strikeouts. Rather, it is about every decision a hitter makes to swing or not to swing. We sought to quantify that decision on a more in depth level than just whether or not the batter makes it to ball four or swings at a pitch outside the strike zone.
Not every pitch in the strike zone is necessarily a good pitch for the batter to swing at. Not all strikes are created equal. A fastball on the outside corner is much more difficult to hit than a hanging curve in the middle of the zone; a hitter is more likely to get a good outcome by swinging at the hanging curve and taking the fastball for a strike, especially in a favorable count. Additionally, a fastball on the outside corner might be called a ball. All of this should be taken into account when evaluating the decision of the hitter to swing the bat or to let it drop.
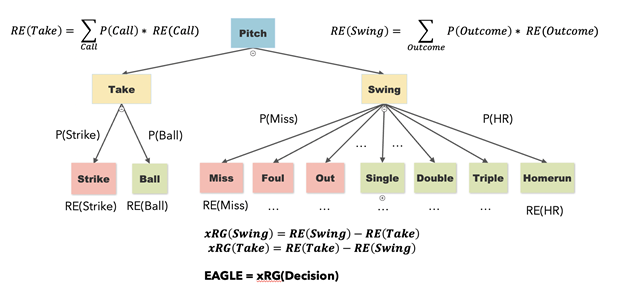
In our approach to evaluating this decision, we broke down the possible outcomes of each decision the hitter could make into the tree below.
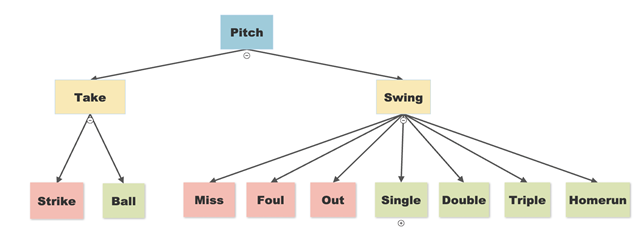
The outcomes of the hitter taking the pitch are relatively straightforward, with either a strike or a ball occurring based on the umpire’s decision, but there are many potential outcomes when the hitter swings the bat. Because of this, we narrowed it down to the seven outcomes pictured: Miss, Foul, Out, Single, Double, Triple, or Homerun.
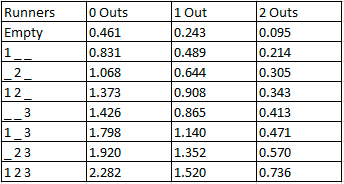
From here we needed to determine what the base metric should be, in other words, what should we be quantifying? Immediately, runs is a very attractive form of units for this metric. Luckily, this can be done with delta run expectancy, devised by Tom Tango. This metric is calculated by subtracting the initial run expectancy from the final run expectancy or, the run expectancy after the pitch. This utilizes a run expectancy matrix like the one below, but including count as well because we are dealing with a pitch by pitch approach.
Now that we have this planned out, we were able to start the process of collecting data and building the models necessary to create EAGLE. We utilized the baseballr package to scrape baseball savant data from the 2019 and 2020 baseball seasons. From here, we merged the delta run expectancies for every possible outcome to each specific pitch so that we now have the foundation laid out and have the runs added (or subtracted) for all of the outcomes that we have defined.
Now that we have the run expectancies of each possible outcome, we need to know the probabilities of each of these outcomes occurring and must understand the effect on run expectancy for of the nine outcomes we specified.
To calculate the run expectancy for each decision, we need the probability each outcome will occur, and the expected runs if it does. We predict the probability a pitch will be called a strike or a ball if the hitter does not swing, and calculate the expected runs for each of those outcomes. Combining those gives us the expected runs in the inning if the hitter takes the pitch. We also need to estimate the probability of each of the seven outcomes if a hitter were to swing at each pitch. We combine those estimates with the expected runs for each outcome to calculate the expected runs if the hitter were to swing.
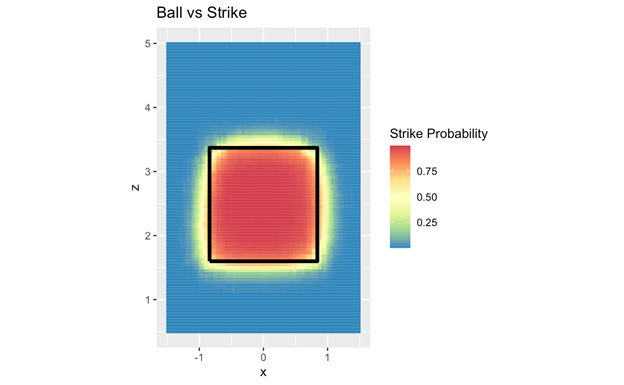
In order to predict the probability of a strike, we used an XGBoost model with a logistic objective in order to capture the nonlinearity of umpires’ decisions. In the end, the independent variables for the model were x-location, z-location, and variables for the top and bottom of the strike zone. The model has an AUC of 0.982, and the estimates of the strike zone for a league-average height hitter are shown below:
To predict outcome probabilities for the swing decision, we trained an XGBoost classification model. We utilized pitch information features like velocity, spin rate, movement, location, and type as well as situational information like count, outs, and pitcher/batter handedness. We also included descriptive statistics about the batter and pitcher listed below:
- Hitter
- PA, AVG, OBP, SLG
- EV, LA, xBA, xwOBA, wOBA, ISO
- Pitcher
- IP, ERA, WHIP, GB/FB, K,BB%
- Average Velocity, Average Spin Rate
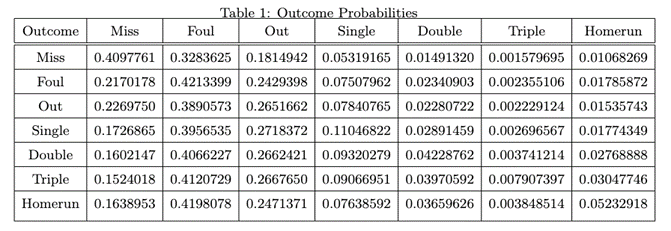
The model was tuned using cross validation to determine the optimal meta-parameters for the model. In this way we were able to reduce the mean squared error and end up with the resulting confusion matrix shown below of probabilities, the true outcomes being the columns and the average predicted probabilities given in the rows. For example, for each pitch which was actually hit for a double, we predicted a 16.0% chance of a swing and miss, a 41.2% chance of a foul ball, and a 4.2% chance of a double (among others). For missed pitches, we estimated a 40.98% chance of a miss, a 32.8% chance of a foul, and only a 1.06% chance of a home run.
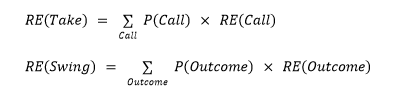
To combine the outputs into a single comprehensive metric, we multiply each outcome probability by the change in run expectancy for that outcome. We add the results together and do this for both the take outcomes and the swing outcomes as in the formulas below.
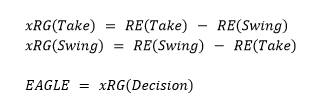
We then end up with a run expectancy for each decision, for swing and for take. We judge the correct decision as the change in run expectancy that is the larger of the two and the player’s EAGLE for that pitch is the difference between the decision taken and the other choice. This is the expected Runs Gained metric defined here. Then EAGLE is just the expected Runs Gained based on the decision made.
Bringing this all together we can illustrate this in the decision diagram from before as you see below:
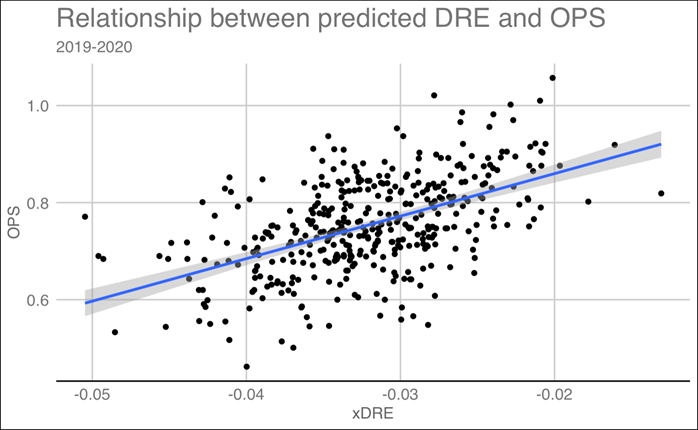
Unfortunately, run expectancy isn’t as straightforward as this. When Mike Trout comes up to the plate, you would expect a different number of runs to be scored than when Freddy Galvis does. To adjust for this, we regressed delta run expectancy on both the situation and the hitter’s OPS. Then we adjusted the original run expectancies of the situations by these corresponding predicted delta run expectancies for the hitter. To show the relationship between delta run expectancy and a hitter’s OPS, we created the visual below.

Now that we have the EAGLE metric, we can investigate its effectiveness and what sets it apart from other plate discipline metrics as well as apply it on the individual pitch and aggregate level in the next article.
To be continued…
Joshua Mould is a Junior at Villanova University studying Computer Science and Statistics and will be an Associate Quantitative Analyst this summer with the Philadelphia Phillies
David Anderson is the Michele and Christopher Iannaccone ‘91 Assistant Professor of Analytics at the Villanova School of Business
Thank you for reading
This is a free article. If you enjoyed it, consider subscribing to Baseball Prospectus. Subscriptions support ongoing public baseball research and analysis in an increasingly proprietary environment.
Subscribe now