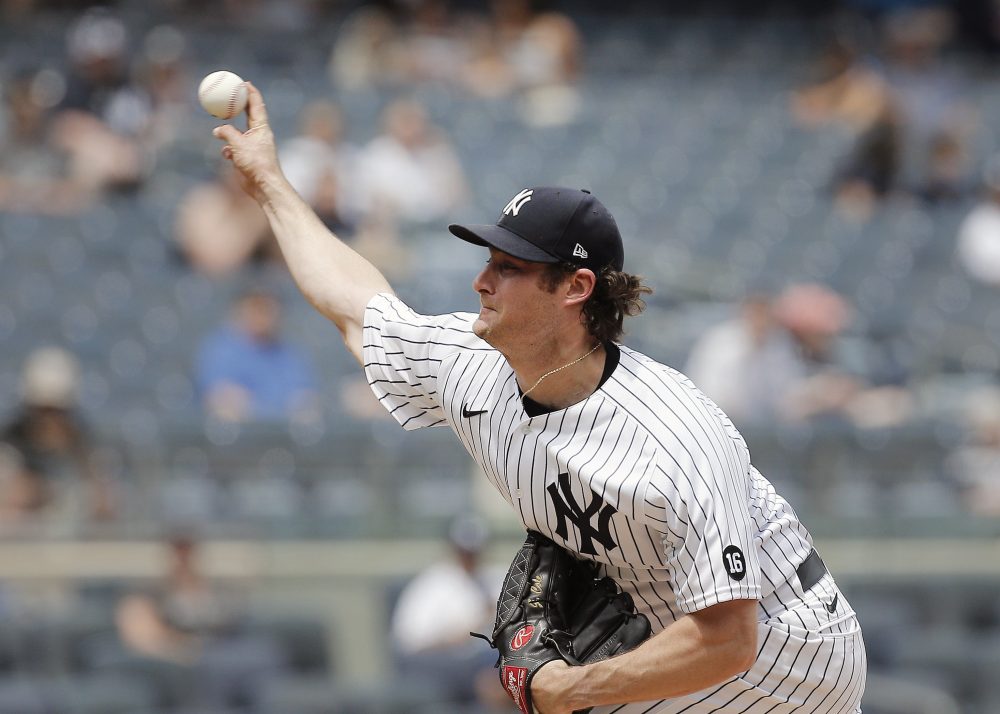
MLB is threatening to crack down on pitchers’ use of materials that, in addition to making the baseball easier to grip, also make the baseball easier to spin. Pitches that spin more also move more dramatically and are harder to hit. With offense in short supply, and pitchers increasingly able to micromanage the design of their pitches, MLB has decided it is time to limit pitchers to the use of rosin, an approved substance which offers less pitch-design potential.
In light of MLB’s announcement, some observers have noticed declines in measured spin, as measured by MLB’s Hawkeye pitch tracking system. When a pitcher’s average spin in a June game has been lower than the pitcher’s seasonal average, some viewers have concluded that the pitcher in question (1) was probably using a forbidden grip substance, and (2) is suffering the consequences of removing it.
As our Rob Arthur has explained, though, this is a complicated issue. Spin is positively correlated with velocity, which can vary between appearances for various reasons. Different pitch types have different desired spin profiles. And even if we account for pitch velocity and type, the question is what difference in average spin is meaningful. To provide a reasonable baseline for recent trends in average pitcher spin, we have modeled recent fastball spin trends in an attempt to find a rigorous potential answer to this question.
With that preamble, let’s skip to the point: average pitcher spin, at least on fastballs, has indeed declined precipitously in June. Viewed in terms of spin-velocity ratio (rpm / mph), the decline is so substantial that it almost certainly could not have happened by chance. Without pretending we know the extent or full motivation behind the changes pitchers have made, the evidence is consistent with a sudden decline in pitchers’ ability to spin their four-seam fastballs that coincides with MLB’s announcement of increased substance enforcement.
Modeling a change in spin
To model this change, we used the following criteria:
- For context, we included all regular season pitches from 2017 to the present for which we had suitable tracking data.
- For consistency, we limited our analysis to four-seam fastballs. To maximize accuracy, PitchInfo pitch classifications were used instead of the default MLB classifications.
- For our output value, we regressed a pitcher’s monthly average spin-velocity ratio in each ballpark as our outcome variable, instead of regressing average pitch spin, or regressing average pitch spin with pitch velocity as an additive covariate. Because pitch spin and pitch velocity are closely correlated, this ratio naturally accounts for the effect of velocity and provides more stable analysis.
- To ensure we are comparing pitchers to themselves, we added pitcher identity as a random effect, with the distribution of average fastball spin assumed to be independent and identically distributed (iid) among pitchers.
- To account for park biases in spin measurement, we controlled for the average role played by a given park in measuring fastball spin by assigning a second iid random effect to each stadium.
- To account for the fact that some changes in pitch speed and spin may be consistently affected by certain months, we added a third random effect designed to control for these seasonal, cyclical effects, which would include average temperature. September and October were combined, as were March and April, for a range of April through September for each season, and the assumption was made that each month had some consistent average effect.
- Finally, to track how average fastball spin had changed over time, after accounting for all of the effects specified above, we assigned a first-order random walk to changes in spin-velocity ratio from April 2017 through the first two weeks of June 2021.
- The values change slightly if you weight or filter by the number of pitches thrown, but those changes are slight because we are already (1) comparing pitchers to themselves (2) using a ratio of two values. We left all pitchers in and did not weight the values.
- All random effects were assigned penalized complexity priors that specified an exponential distribution intended to encompass 99% of their expected values.
- To confirm the validity of the chosen variables, we used the Watanabe–Akaike information criterion (WAIC) and further confirmed that the expected values for all covariates in the model far exceeded their respective standard deviations.
Without further ado, here is what our models find to be the monthly change in average pitcher spin-velocity ratio on four-seam fastballs since April 2017, relative to overall league average over that time period. We have shaded successive seasons for readability:
| Season | Month | Average | SD |
| 2017 | April | -0.17 | 0.03 |
| 2017 | May | -0.22 | 0.03 |
| 2017 | June | -0.13 | 0.03 |
| 2017 | July | -0.17 | 0.03 |
| 2017 | August | -0.20 | 0.03 |
| 2017 | September | -0.24 | 0.03 |
| 2018 | April | -0.21 | 0.03 |
| 2018 | May | -0.22 | 0.03 |
| 2018 | June | -0.17 | 0.03 |
| 2018 | July | -0.13 | 0.03 |
| 2018 | August | -0.12 | 0.03 |
| 2018 | September | -0.03 | 0.03 |
| 2019 | April | 0.06 | 0.03 |
| 2019 | May | 0.08 | 0.03 |
| 2019 | June | 0.13 | 0.03 |
| 2019 | July | 0.14 | 0.03 |
| 2019 | August | 0.19 | 0.03 |
| 2019 | September | 0.23 | 0.03 |
| 2020 | July | 0.23 | 0.03 |
| 2020 | August | 0.24 | 0.03 |
| 2020 | September | 0.22 | 0.03 |
| 2021 | April | 0.17 | 0.03 |
| 2021 | May | 0.25 | 0.03 |
| 2021 | June | 0.06 | 0.04 |
The change is more striking as a plot if we focus on a few months from each season around June, and then show the change from May 2021 and June 2021 at the end:
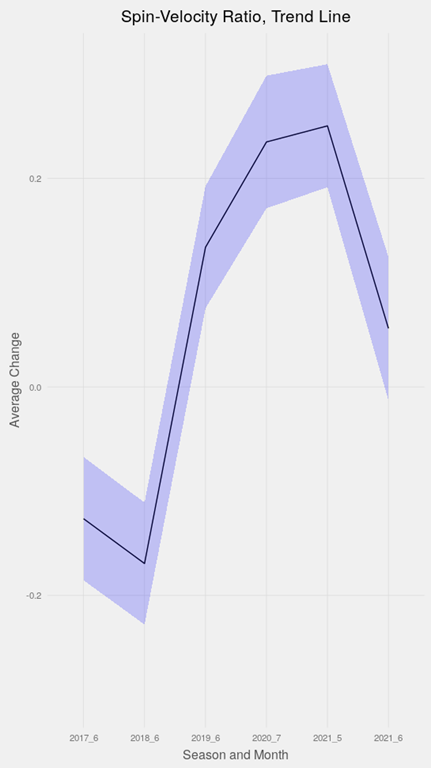
This plot shows not only a dramatic and consistent rise in average pitcher spin-velocity over the past four years, but also a dramatic partial decline in only two weeks (!) of this month. It’s worth noting that a good portion of the previous improvement in average fastball spin is likely the result of pitch optimization rather than solely due to use of prohibited substances, so the entire increase may never go away.
Finally, let’s focus our table from above on our two months in question, May 2021 and June 2021:
| Season | Month | Average | SD |
| 2021 | May | 0.25 | 0.03 |
| 2021 | June | 0.06 | 0.04 |
What is the probability that a change this steep could occur purely by chance? Treating the two distributions as approximately normal, the answer rounds to zero under any reasonable approach. That is consistent with the steepness of the drop plotted above.
Giving the magnitude of the change in average pitcher spin, and the timing of the change relative to the league’s crackdown announcement, it is reasonable to conclude that MLB was correct in its assessment of the effect that grip-enhancing substances have increasingly had on pitcher spin, and that its declared intention to root the substances out of the game is starting to have the desired deterrent effect. It remains to be seen how much more of an effect MLB’s enforcement initiative will have, and whether it will have the desired impact of increasing offense in the game.
Thank you for reading
This is a free article. If you enjoyed it, consider subscribing to Baseball Prospectus. Subscriptions support ongoing public baseball research and analysis in an increasingly proprietary environment.
Subscribe now