keyboard_arrow_uptop

PECOTA’s 2020 Standings Projections

If you rub a crystal ball it will show you the future. If the ball is cracked you might cut yourself. Injury is more likely than insight. Still, it is time for the annual feasting on the expectations of our projection system with the 2020 PECOTA Standings.

We’re making some changes to the presentation of our standings. This year, we’re skipping what we used to call the “Depth Chart” standings and jumping right to what was known as our Playoff Odds. Changes in the PECOTA engine are relevant to this, too.

The inputs are still created by PECOTA and passed through our human-curated Depth Chart playing time estimates. Once the season begins, we’ll combine that with 3rd-order win percentages.

We’ve also made some small tuning—and will continue to do so most of the spring—to the Monte Carlo simulation, but nearly everything you read about it here and here still holds true, with one notable exception.

We did our best to balance the eye-friendliness of the W-L records with the viability of the postseason probabilities. Compared to the past, this allows things like the Dodgers being the division winner in nearly each of the 1,000 simulations we most recently ran to happen.

We’ve added some new visualizations (example below) to show you the range of outcomes. These are in addition to the nifty timelines you know and love; they will return once the season begins.
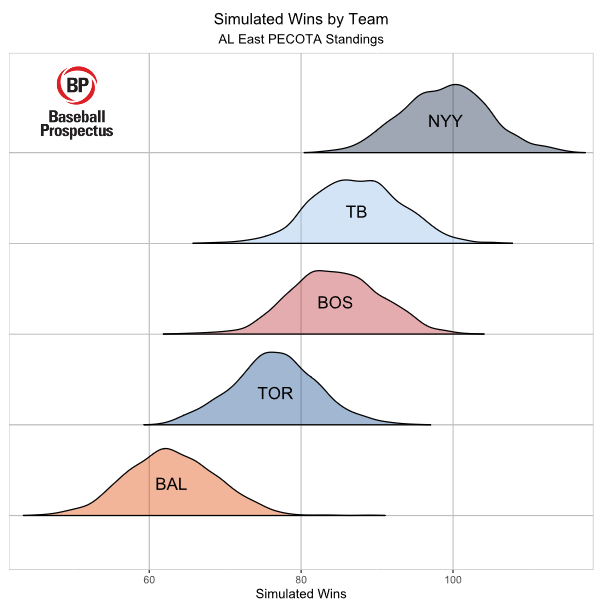
Please remember that PECOTA and our simulations do not “pick” a team to “win” any particular number of games. Rather, they identify an estimated range of games a team might win and tells you the average of that fairly wide range. That is the point of the visualizations. Any one of those outcomes is possible. However, some of them, as you can see, are more likely than others.

Also remember that it’s early: Pitchers and catchers are just trading tee times for bullpen sessions. These standings will continue to be tuned over the next several weeks until we reach Opening Day. Do not be surprised if your team moves up or down a few games as rosters finalize and additional tweaks are made.

For more on PECOTA, go here.

Thank you for reading

This is a free article. If you enjoyed it, consider subscribing to Baseball Prospectus. Subscriptions support ongoing public baseball research and analysis in an increasingly proprietary environment.

Subscribe now
You need to be logged in to comment. Login or Subscribe
Kerry Brashears
2/11
CHC, CWS, LAD playing 163 games?
Craig Goldstein
2/11
It's a rounding issue. The standings will show to the decimal, shortly, which will eliminate that issue.
ChicagoOriole
2/11
How low does that tail go for Baltimore? 45? Yeah, I can believe that. I can't believe the winning record one though.
Harry Pavlidis
2/11
Part of the fun is the outlandish results that come up in 1000 sims. Just wait til we do 100,000 for an article in March!
brewerstt
2/11
"Why not! It's really happening, now the birds are on the wing...." Although that team had Cal Ripken and Mickey Tettleton and Gregg Olson...yeah, there's no comparison.
Matthew Szerzinski
2/11
Are you planning on including World Series Odds similar to the old Playoff Odds page?
Harry Pavlidis
2/11
Yes. Need to fix a bug with the adj playoff odds, and then move on to those.
Carl Goetz
2/11
Are adj Playoff odds simply the odds of making the Wild Card Game? And Playoff odds, the odds of winning Division OR making WC Game?
Ginny Searle
2/11
Playoff % is the chance to make the Wild Card Game, Playoff % Adj is the chance of moving to the divisional round (i.e. winning that game or a division)
Carl Goetz
2/11
Doh! Guess that should have been obvious. Thanks for you help.
John Seal
2/11
Thanks to PECOTA for once again projecting the Oakland A's to be a mediocre team. Every year!
Greg Miller
2/11
You're skipping the "Depth Chart Standings", but didn't I read that the actual 2020 Depth Charts (with playing time adjusted projections & all) would be live soon?
Harry Pavlidis
2/11
It's there, just with playing time. We'll add the stats and goodies to them soon. https://www.baseballprospectus.com/orgs/new-york-mets/depth-charts/
Peter Collery
2/11
Something is wrong with your adjusted playoff odds, at least in the AL. They only total to 328%.
Harry Pavlidis
2/11
Should be fixed now, sorry for the mistake.
Stephen Ledet
2/11
Do not like the new depth chart format. Don't like the lack of stats, War, DRA, etc. Sorry
john
2/11
Ditto on this comment. Are the individual player projection stats no longer going to be displayed in Depth Charts ? Or will that wait until the Annual is published so web site doesn't steal the suspense ?
Harry Pavlidis
2/11
coming soon
Byron Hauck
2/12
The new depth charts format manages to use a lot more space to give us a lot less information. There's nothing to show how you project the players will do (other than saves?), and I'd much rather see number of games or PA rather than % of PT, but if you're going to do a percent, please put a % in there so I don't spend a few minutes wondering why you're projecting a 100 game season.
Byron Hauck
2/12
I'm sorry, I don't know how I didn't see the Stephen - John - Harry chain above me. I resurrected this tab from yesterday, maybe it was cached before that comment was made? Whatever, sorry for the repeated complaint.
Jeff Kuykendall
2/19
Will BP publish projected RS/RA in the Pecota Standings? Also, will The Ax provide Projected BWARP and PWARP for the remainder of the season. If not, where might that information be found in season. Thanks
Arnold
3/09
Wondering the same thing Jeff. This is the primary reason I am subscribed to BP.
Jared Wexler
3/05
I am desperately trying to find the PECOTA projected runs scored and runs allowed by team. They used to be in the projected standings but that hasn't been updated since September. Will that information be published on this website somewhere?