Welcome to the third and final instalment of my look at the meaningfulness of the first few dozen games of a team season. (Go back and review Parts 1 and 2 here. There will be a test later.) This final article looks to merge a team’s starting record with its established performance over the past few years, to come up with a formula that most accurately projects its final record based on the available data. Warning: If you thought Part 2 was laden with too many equations, you’re not going to like Part 3 any better.
I ended Part 2 with a projection that the Royals, based on their 17-5 start, are projected to finish with about 97 wins. The folly with that logic should be self-evident, but let me share some evidence with you to make the point a little more clear.
When the Royals’ record reached 13-3, my inner circle of fellow Royals fans finally got serious about questioning whether such a strong start really meant anything in light of the team’s 100-loss season in 2002. I decided to look for comparable teams throughout history that had gotten off to a similar start. Using my database of all teams from 1930 to 1999, I found a total of 75 teams that started the season either 12-4, 13-3, or 14-2. Sixty-three of those teams, or 84%, finished above .500. As a group, they finished with a .545 winning percentage.
But it’s not all roses. Because I then whittled down that group to look only at those teams that had played less than .420 ball the previous season, which corresponds to a 68-94 record or worse. I was left with five teams:
- The 1932 Boston Braves, who went 64-90 in 1931, started 12-4, and finished 77-77.
- The 1935 White Sox, who went 53-99 in 1934, started 13-4, and finished 74-78.
- The 1982 Padres, who went 41-69 in 1981, started 12-4, and finished 81-81.
- The 1988 Indians, who went 61-101 in 1981, started 14-3, and finished 78-84.
-
And most impressively, the 1978 Oakland A’s, who went 63-98 in 1977, started
14-3 and eventually reached a 19-5 record…before finishing 69-93, meaning they
went 50-88 after their 24-game opening salvo.
The 1988 Indians are probably the most comparable team to these Royals; they are the only team in the study to have a winning percentage of .750 or better at any point in the season from the 15-game mark on, following a 100-loss season. (The 1987 Indians, you may recall, were predicted by Sports Illustrated to win the World Series, then finished with the worst record in baseball.)
In other words, while 63 of the 75 teams in the study finished above .500, those 75 teams break down this way:
- Of the 70 teams that played better than .420 ball the previous year, 63 (90%) finished above .500.
- Of the five teams that played under .420 ball, none finished above .500.
All of which is just a roundabout way of saying that in trying to project your favorite team’s record this season, your favorite team’s record last season might be a good place to start.
So let’s back up a minute, and ask a basic question: At the start of any given season, before any games have been played, how can we best project a team’s final record using only its record the previous year?
Here’s a plot of those same 1300 teams, comparing their record in each season with their record the year before:
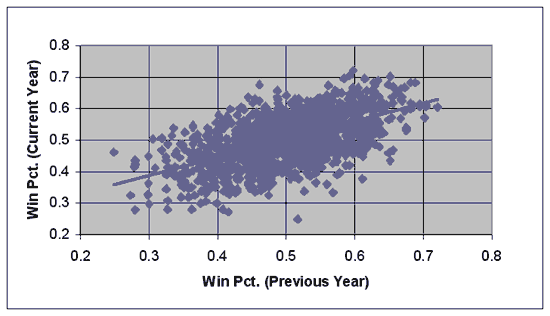
As you can see, there’s a pretty straightforward, linear relationship, but it’s imperfect at best. The best-fit linear equation for this graph is:
Y = .204 + (.592 * X)
Which can also be written as:
Y = (.408 * .500) + (.592 * X)
Which means that, to project a team’s winning percentage this year, their previous season’s record counts for about 59%, and a .500 record counts for about 41%. Regression to the mean will get you every time, pulling all teams back towards .500. A team that played .600 ball last year can expect to play about .559 this year.
The r2 of this equation is .370, which means that last year’s record explains about 61% of the variation between teams’ records this year. (The square root of .370 is .608, which is where 61% comes from.) Can we do better? Sure, if we incorporate more information, like how a team fared a little further in the past. After all, when trying to project how the Houston Astros would finish in 2001, you could simply look at their 2000 record (when they finished 72-90), or you could dig a little deeper and notice that they won 97 games in 1999, and 102 games in 1998. (They would win 93 games and the division in 2001.)
This is a job for multivariate regression analysis, where multiple variables–in this case, a team’s winning percentage last year, their winning percentage two years ago, etc.–are analyzed to determine how much weight each variable should possess, if any at all. So I ran this very analysis from 1930 to 1999, taking out not only strike years but also the seasons immediately around expansion years. This was done because, for instance, the teams in the NL in 1968 would finish, as a group, significantly above .500 in 1969 because the new teams, the Padres and Expos, both lost 110 games in their first year. Even so, there were over 1100 teams in the study, lending considerable credibility to the results.
The first thing linear regression tells you is which variables are not useful in determining this year’s record. In this case, there is no statistically significant association between, for instance, how the Yankees fared in 2001, and their record in 1997 or before. Only the three most recent seasons have a bearing on a team’s record.
Here’s the formula:
Y = .1557 + (.4517 * X1) + (.1401 * X2) + (.0968 * X3)
Where X1 is the team’s winning percentage the year before, X2 is their winning percentage two years ago, and X3 is their percentage three years ago.
The formula can be expressed in a different format:
Record last year:       45.17%
.500 record:            31.14%
Record two years ago:   14.01%
Record three years ago: 9.68%
Using this formula, we could have projected the 2003 Royals, before the season began, to finish with a winning percentage of:
Y = .1557 + (.4517 * .3827) + (.1401 * .4012) + (.0968 * .4753) = .4308
A winning percentage with translates to a 70-92 record.
(If you want a quick-and-dirty formula that’s easy to remember, take three parts last year’s record, two parts a .500 record, one part the record from two years ago, and 2/3 part the record from three years ago. The weights are virtually identical; using this formula instead would have projected the Royals to finish with a .4299 winning percentage.)
Hidden in this jumble of numbers are two very important baseball principles which have been known for over a decade. One of them, as I’ve mentioned before, is the concept of regression to the mean (what Bill James called the “Whirlpool Effect”) because, over time, teams are drawn to .500 in the same way that water is drawn to a drain. According to this formula, the Whirlpool Effect explains about 31% of a team’s record in any given year. A team that has consistently played .600 ball over the past three years would be expected to play .569 ball this year; teams that want to maintain above-average play have to find a way to compensate for the tendency to lose 31% of their edge, year after year.
The other principle explained by this formula is something known as the “Plexiglass Principle”, which posits that teams that make sudden surges forward in the standings from one year to the next tend to fall back the following year, and vice versa. The 2001 Astros, as discussed above, are an excellent example. The 2000 Astros won just 72 games, a 25-game drop from their 2000 campaign. The Plexiglass Principle holds that rather than continuing their momentum and falling further, the Astros were likely, in 2002, to bounce back a little bit.
But whereas this principle has always been framed in terms of the improvement or decline from one year to the next, this formula looks at the principle differently. It’s not that the Astros were likely to improve in 2001 because they declined in 2000. Rather, it’s that the Astros’ record in 1999 (when they won 97 games) impacts their projection just as their record in 2000 does, albeit to a lesser degree.
If you look at the data in this light, the Plexiglass Principle becomes essentially invisible. Once you factor in how a team played in each of the past three years, the degree to which they’ve improved or declined in that span becomes irrelevant.
Just for fun, let’s plot each team’s record against their projected record, using this formula:
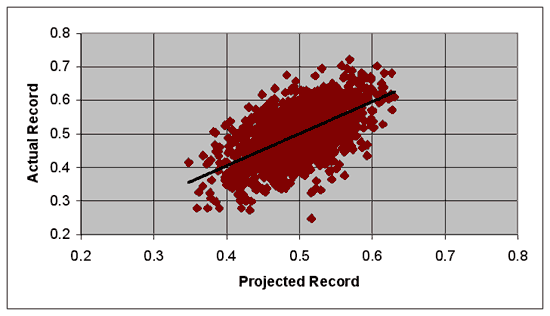
The slope of the best-fit line is equal to one, which means a one-point increase in a team’s projected winning percentage corresponds to a one-point increase in their actual percentage, as it should. The individual data points are also clustered closer together, because the formula does a better job of projecting a team’s record than simply looking at last year’s record, which was done in the first graph. (This is also reflected in the r2 value of this graph, which is .402.)
So now that we have an accurate formula to project a team’s record before the season has begun, we’re in a better position to modify that projection based on a hot or cold start to the season.
From now on, I’m going to use the variable P as shorthand for a team’s projected winning percentage, which again is calculated by the formula (.1557 + (.4517 * X1 ) + (.1401 * X2) + (.0968 * X3)). The variable S will describe a team’s winning percentage in its current season. As I write this, the Royals are 19-9, so their S is .679, while their P is, as calculated above, .431.
How does a team’s performance in the first month or two of the season change their projection? In mathematical terms, how does S interact with P to arrive at an even more accurate projection? Let’s look at the data.
One method to determine this interaction is to perform a linear regression using the two variables, looking at the data after a 10-game start, 15 games, etc., just as we did in Part 2. For instance, 20 games into the season, the formula that most accurately projects a team’s final winning percentage is:
Y = (.7596 * P) + (.2404 * S)
So that, after 20 games, a team’s current record is responsible for about one-quarter of their final record; their pre-season projection is still three times as relevant as their current record.
Here is the data at five-game intervals:
10 games:       Y = (.8693 * P) + (.1307 * S)   r2 = .480
15 games:       Y = (.8239 * P) + (.1761 * S)   r2 = .502
20 games:       Y = (.7596 * P) + (.2404 * S)   r2 = .536
25 games:       Y = (.7134 * P) + (.2866 * S)   r2 = .558
30 games:       Y = (.6524 * P) + (.3476 * S)   r2 = .587
35 games:       Y = (.6352 * P) + (.3648 * S)   r2 = .585
40 games:       Y = (.5807 * P) + (.4193 * S)   r2 = .613
45 games:       Y = (.5400 * P) + (.4600 * S)   r2 = .642
50 games:       Y = (.4782 * P) + (.5218 * S)   r2 = .660
As we would expect, the more games a team has played, the more relevance their record this season takes on compared to their record in previous seasons (as shown by the increasing coefficients for S, and the decreasing coefficients for P), and the more accurate their new projection is (as shown by the increasing r2 values).
Let’s graph this data:
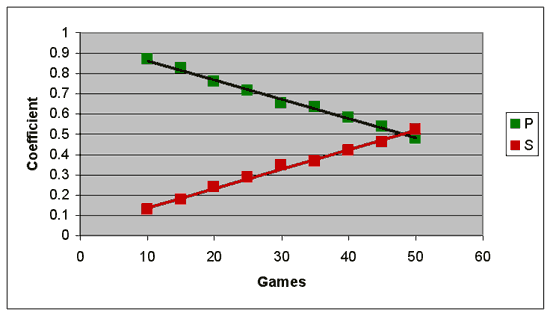
A nice, linear relationship can be seen here: The more games a team plays, the more its record in the ongoing season matters. And where the lines cross–just eyeballing the graph, around the 48-game mark–a team’s current winning percentage has exactly as much predictive potential as their projected record based on the previous three seasons.
Since the graph is so linear, we can come up with best-fit formulas for the two lines on the graph, which will give us a single formula that can project a team’s final winning percentage based on P and S.
That formula is:
Y = ((.9577 * P) - (.0095 * G * P)) + ((.0423 * S) + (.0095 * G * S))
Where G is the number of games played in the current season.
Before you ask: Yes, we can simplify that formula.
Y = (.9577 * P) + (.0423 * S) + (.0095 * G * S) - (.0095 * G * P)

Y = P - (.0423 * P) + (.0423 * S) + (.0095 * G * (S - P))

Y = P + (.0423 * (S - P)) + (.0095 * G * (S - P))
To simplify this formula further, let’s call (S – P)–which is the difference between a team’s current winning percentage and their projected winning percentage–I. Think of I as standing for “improvement,” keeping in mind that I can be a negative number if a team is playing worse than its projection.
Y = P + (.0423 * I) + (.0095 * G * I)

Y = P + (I * (.0423 + (.0095 * G)))
In other words, in order to calculate a team’s final winning percentage–Y–you must first start with its projected winning percentage at the start of the season, P. From that point on, P is your baseline. Once the season begins, though, P will be modified up or down by the term (I * (.0423 + (.0095 * G)).
Let’s look at an example, using those lovable 1984 Tigers.
Before the season began, the Tigers’ projected winning percentage based on their records from 1981 to 1983 was .537. But after starting 35-5…
P = .537
S = .857 (35-5)
I = .320 (.857 - .537)

Y = P + (I * (.0423 + (.0095 * G)))
Y = .537 + (.320 * (.0423 + (.0095 * 40)))
Y = .537 + (.320 * (.0423 + .3800)
Y = .537 + (.320 * .4223)
Y = .537 + .135
Y = .672
So putting together the team’s 35-5 start with its considerably less impressive record the previous three seasons, the Tigers would have been expected to play .672 ball the rest of the way, meaning they’d win about 109 games. Note that this is considerably lower (and more accurate) than our projection in Part 2, which was based solely on their 40-game start (we projected them to win 115 games). As impressive as 35-5 sounds, our new formula expresses some skepticism, based on the fact that the Tigers hadn’t won more than 92 games in any of the previous three seasons. As it turns out, this skepticism was warranted, as the Tigers won “only” 104 games.
So is that it? Unfortunately, not exactly. As elegant as the above formula was, it was for demonstration purposes only. My mathematician friends are, no doubt, rolling their eyes at my methodology, as I committed a major faux pas by performing a linear regression on a linear regression, or something like that. The proper method for determining a final formula is to perform a multivariate regression taking all the variables into account from the beginning. (Just trust me on this point; it will be easier and more painless.)
Fortunately, the above run-through not only explained the process in a much more digestible fashion, but also gave us a formula that’s almost identical to what was derived from the multivariate regression. Instead of using the formula:
Y = P + (I * (.0423 + (.0095 * G)))
The actual formula should read:
Y = P + (I * (.0415 + (.0096 * G)))
Not a huge difference by any means, but tenured professors have killed over more trivial matters, and I have a family to support.
And there, finally, is our answer. If you want to determine a team’s final record, based on its record in the early going, all you have to do is follow this simple, two-step procedure.
STEP 1
Determine that team’s projected record based on its winning percentage the previous three seasons, using the formula:
P = .1557 + (.4517 * X1) + (.1401 * X2) + (.0968 * X3)
Where X1 is last year’s pct., X2 is the pct. two years ago, X3 three years ago.
STEP 2
Determine their final winning percentage:
Y = P * (I * (.0415 + (.0096 * G)))
Where S is the team’s current winning percentage, G is their number of games played, and I = S – P.
That’s it. Now comes the fun part: taking the formula out for a test drive.
Let’s start with a few oldies, just to see how the formula does when put to the test. I looked for the four teams that had the biggest disparity between their record at 40 games, and their pre-season projection. Those four teams are:
      Team     Start     X1      X2      X3       P       S       Y     Actual

1946 Red Sox    31-9    71-83   77-77   68-84   .4773   .775    .6030   .6753
1951 White Sox  29-11   60-94   63-91   51-101  .4215   .725    .5497   .5260
1984 Tigers     35-5    92-70   83-79   60-49   .5373   .875    .6799   .6420
1988 Orioles    6-34    67-95   73-89   83-78   .4555   .150    .3265   .3354
(To make the data more readable, I listed records instead of winning percentages for X1, X2, and X3.)
The projections aren’t perfect, although the 1988 Orioles come close. But only one of the projections is really bad, and the 1946 Red Sox have an obvious excuse: The team was getting all its stars back from World War II, so we would expect that the club’s performance in its first 40 games with Ted Williams, Johnny Pesky, Bobby Doerr, and Dom DiMaggio to be a little more relevant than its performance in 1945 with Catfish Metkovich, Eddie Lake, and Skeeter Newsome.
Enough with the past–if I wanted to know how a team finished in 1946, I’d go to baseball-reference.com. Let’s see what these formulas tell us about the present.
Allow me to start with the Royals, 19-9 through Sunday’s games.
P = .4308, as calculated above.
S = .6786 (19-9)
I = .2478 (.6786 - .4308)
G = 28

Y = .4308 + (.2478 * (.0415 + (.0096 * 28)))
Y = .4308 + .0769
Y = .5077
So even after starting the season 19-9, the Royals are projected to finish just 82-80. (Even when the Royals were 16-3, their final projection was just .5229, or about 85 wins.)
Given that none of the five comps I listed at the start of this column finished above .500, you could argue that even 85 wins was too generous a projection–but it’s certainly a more reasonable estimate than the 97 wins we projected at the end of Part 2, when the only piece of data we considered was the team’s performance this season.
Here’s how some other red-hot teams project:
Team    Start    X1      X2      X3      P       S       Y     Final Record

Royals  19-9    62-100  65-97   77-85   .431    .679    .5077   82-80
Yankees 23-8    103-58  95-65   87-74   .580    .742    .6350   103-59
Giants  21-9    95-66   89-73   97-65   .557    .700    .6042   98-64
And one team that’s ice-cold:
Tigers 4-25 55-106 66-96 79-83 .414 .138 .3259 53-109
Tiger fans, rejoice! Despite starting the season with 25 losses in 28 games, coming on the heels of a 106-loss season a year ago, your team does not project to be the first to lose 110 games since 1969. But man, they’re close.
And that’s it for me. I thank you all in advance for your patience and understanding over the next three months, and I hope to return to my regularly scheduled columns some time in late August.
In the meantime, I won’t completely disappear, at least not as long as the Royals are in first place. You can still watch, riveted to your seat, as Rob Neyer and I continue to argue over whether the Royals actually have a snowball’s chance in hell of winning the division (I say yes, he says no). And if you’re into masochism, you can read my weekly columns on the Royals for the Topeka Capital-Journal.
I also have one public appearance to make between now and August. On July 10th, at the SABR Convention in Denver, I am slated to appear on the “Baseball at Altitude” panel, where I can wax poetic on how altitude affects players’ performances, and how the Rockies should adapt to those effects. Scheduled to join me on the podium are a couple of guys you may have heard of: Dr. Robert Adair, erstwhile Physicist of the National League, and Dan O’Dowd, who I understand works for a baseball team somewhere.
No pressure.
Thank you for reading
This is a free article. If you enjoyed it, consider subscribing to Baseball Prospectus. Subscriptions support ongoing public baseball research and analysis in an increasingly proprietary environment.
Subscribe now