Let me begin by saying this: this was not my idea. Last Friday, I attended a talk at the Massachusetts Institute of Technology given by Farhan Zaidi, formerly the AGM in Oakland and currently the GM of the Dodgers. (He’s one of many.) During the course of his talk, Zaidi highlighted the phenomenon I’m about to describe—among others—as an example of intriguing applications of economic theory to baseball analysis. He credited this particular discovery (if that is, indeed, the correct term) to his in-house R&D team. So, credit goes to you, anonymous L.A. baseball ops staffer. I’m sorry I don’t know your name.
A further note: While Zaidi never explicitly said that his comments were on the record, and he has not participated in any way in the development of this story (except as inspiration, as detailed above), neither he nor the organizers of the event implicitly or explicitly forbade video or audio recording, nor did they ask that insights shared during the course of the talk stay confidential. The event was listed publicly on MIT’s website, and at no point during the course of the event was I asked for proof that I was an MIT student (or a member of the undergraduate Economics Society, which hosted the event). In fact, several minutes before Zaidi shared this particular phenomenon, I asked him a question during which I identified myself as a writer for Baseball Prospectus, and so I’m confident he was aware that whatever he said from that point forward might end up in the public domain.
Point is, if what I’m about to share isn’t supposed to be shared, and is in fact considered proprietary information by the Dodgers, they’re doing a really bad job of keeping it that way. So, I’m operating under the assumption that it is indeed shareable, and am sharing it. Here. Still, if that’s not the case, and it wasn’t meant to be shared, I’m sorry. Data security is important. Let’s move on.
Here’s what Zaidi said his R&D team had found: Batters who reach 3-1 counts by way of a taken first strike on 3-0 swing at the next pitch more often than batters who reach 3-1 from a 2-1 count.
Zaidi’s hypothesized explanation for the difference in approach between two identical counts was that big-league batters—who are, for the most part, highly competitive people—feel like they’ve been “cheated” out of a swing when they take on 3-0 (as they did approximately 92.7 percent of the time since the 2011 season) and so are basically jumping out of their shoes to swing on the next possible pitch. The in-game applications are obvious: pitchers facing batters who’ve just taken a 3-0 pitch for a strike should throw a pitch out of the zone on 3-1 because, more often than is otherwise the case, the batter is going to swing regardless of what the pitch is. The Dodgers have, according to Zaidi, implemented this approach in-game.
I don’t have the resources to test Zaidi’s explanation for the behavior. But I was curious about the behavior itself, and what the magnitude of the effect was. So I pulled some data. Since 2011, qualified batters have seen 37,799 pitches on a 3-1 count. Of those pitches, 26,170 (69.2 percent) came after a 2-1 count. Another 10,595 (28.0 percent) came after a 3-0, and after the batter took a strike to run the count to 3-1. And the final 1,034 (2.7 percent) came after the batter swung and missed on 3-0 to run the count to 3-1. Since no batter saw more than nine pitches in the last category, we’re going to discount that strata as too limited, and focus on the first two instead: 3-1 counts from 2-1s, and 3-1 counts from 3-0 takes.
Ready for the results? You bet. Of the 26,170 3-1 pitches seen immediately after a 2-1 count, batters swung 14,602 times, or 55.8 percent of the time. And of the 10,595 3-1 pitches seen immediately after a 3-0 take, batters swung 5,877 times, or … 55.5 percent of the time.
Well.
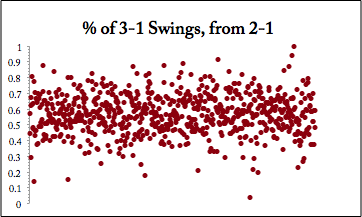
When I ran these numbers for the first time, I was confused. Could it possibly be that Zaidi was wrong? No. He’s paid way too much to be wrong about something as simple as this. Were my numbers wrong? No. I checked the calculations twice. So what the heck was Zaidi talking about? Well, I’m not sure anymore. But I have a guess. Here’s the thing: while the means of the two samples are pretty much identical, their distributions are not. Here’s a plot of the first group:
And here’s a plot of the second:
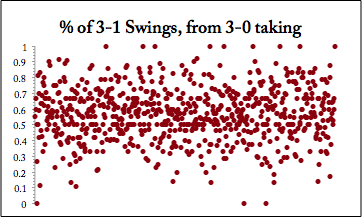
In some ways, the two charts look pretty similar: no big clumps of batters anywhere, and—as we just found out—both are clustered around basically the same mean. But look how much more the data in the second chart are spread out along the vertical axis. In short, while there isn’t too much variation between hitters with respect to their tendencies in the first category of 3-1 count, there is quite a bit of variation in the second. Let me show you what I mean:
Swing Rates, By Percentile
|
Percentile |
3-1 from 2-1 |
3-1 from 3-0 take |
Delta |
|
60th |
.600 |
.609 |
.009 |
|
70th |
.636 |
.667 |
.030 |
|
80th |
.667 |
.700 |
.033 |
|
85th |
.694 |
.733 |
.038 |
|
90th |
.724 |
.786 |
.062 |
|
95th |
.765 |
.833 |
.068 |
|
99th |
.865 |
1.00 |
.135 |
At the 60th percentile of both data sets, batters swing at nearly the same rates at both types of 3-1 counts. But as you get to more and more extreme batter profiles (moving down the table above) the difference between the two groups widens. By the time you hit the 99th percentile of batters, hitters who reach a 3-1 count from a 3-0 take are 13.5 percentage points (!) more likely to swing than batters who reached the same count from 2-1.
This means—and this is the really important part—that while a big-league hitter, on average, is just as likely to swing on a 3-1 count achieved after a 2-1 count as he is on the same count achieved from a 3-0 take, certain big-league hitters are far more likely to swing in the second count than the first. It’s those batters, I assume, that Zaidi and the Dodgers are targeting. Just something to watch out for, as you take in the game of baseball during this fine spring of 2016.
*A few random notes: the hitter (min. 20 such PAs) with the highest swing rate on a 3-1 count after a 3-0 take, since 2011? Derek Jeter, who swung at 18 of 20 such pitches in 2011. The lowest? Dee Gordon in 2014, who swung at just 1 of 27 3-1 pitches he saw after taking 3-0 for a strike.*
Thank you for reading
This is a free article. If you enjoyed it, consider subscribing to Baseball Prospectus. Subscriptions support ongoing public baseball research and analysis in an increasingly proprietary environment.
Subscribe now
To test whether specific hitters have different approaches in the two situations, you would want to look at how actual players swing percentages change from one situation to the other. The percentile table purports to be making something like this comparison, but the groups of hitters in the percentiles in each case aren't necessarily the same. Do certain hitters persistently swing more in the second situation year-to-year?
Also, are they seeing a similar mix of pitches and pitch locations in both situations? This sort of analysis assumes that the pitchers don't alter their approach, and we wouldn't expect them to since the situations look symmetric. But considering that we are asking whether hitters irrationally treat the situations asymmetrically, shouldn't we consider the possibility that pitchers are as well (or that they are pitching differently in response to the hitters' altered approach)? Maybe the aggregate swing percentages are the same but the swings are at harder pitches to hit.
This raises some interesting questions.
To answer your second question: yes, at least in the last five-year sample, certain hitters persistently swing more in the second situation year-to-year. That said, I'm not sure that matters, because you'll never have to choose between facing them in one situation or another---you'll just *be* in a particular situation, and know their tendencies.
As to the third point: I'm not a particularly sophisticated user of game theory, so I haven't got a smart way to tackle this problem. I can dive into the pitch-mix/pitch-location data and get back to you. It's definitely worth considering.
Thanks for reading, and for such great clarifications.
I didn't bring up the 2nd/3rd points as criticisms of your article, just as places to maybe look for evidence of the effect Zaidi is describing. Persistence of increased swing rate year-to-year would be (potentially strong) evidence that this effect exists. It also matters because, if certain hitters are swinging more in the 3-0/3-1 situation, but the aggregate swing rates are the same, then either a) certain hitters are swinging less from one situation (which runs counter to Zaidi's claim) or b) there is something different about the hitters/pitchers in (or something about) the two groups.
The third point also suggests a potential limitation to the operational usefulness of this information: maybe the aggregate swing rates are the same because the pitcher's who found themselves in 3-0 counts are on average less skilled in the command/control department (I think this is a reasonable hypothesis) and are more wild with the 3-1 pitches, leading to similar overall swing rates despite an increased willingness from the hitters to swing. This would suggest that even if hitters are more likely to swing on 3-1 after being in a 3-0 count, the pitchers may be ill-equipped with the skills to take advantage.
This very interesting stuff, though I'm skeptical it has much practical application (perhaps why Zaidi let it slip into the public domain?).