Last week we took a look at the pitchers who have suffered the largest knocks to velocity in the 2015 season, and today we examine the other side of the coin.
Here's a quick refresher on the rules: The sample is limited to pitchers who started at least 10 games and threw 500 or more fastballs (four-seam plus sinkers) in each of the previous three seasons. In order to qualify, a pitcher must have shown a velocity-gain of at least 0.5 mph from each of the previous two seasons (so 2015 performance compared to '14 and '13). The velocities shown reflect a weighted average of four-seam fastballs and two-seamers/sinkers, taken from the awesome resource at www.BrooksBaseball.net, and only cover pitches thrown in the regular season at the MLB level.
The list of pitchers who realized gains to their pitch-speed last season is much shorter than the velocity-decline list, and I had to lower the threshold for inclusion in order to have a large enough group of velo-gainers to investigate. This is why the one-mph difference over one of the previous two years – which was necessary to qualify for the list of velocity-decliners – has been eliminated for the set of pitchers who improved pitch-speed. Even with these softer restrictions, there were just 10 players who qualified with a 2015 velo that was at least 0.5 mph higher than the previous two seasons, which is less than half of the 21 pitchers who qualified for the speed-drop group. The trend is indicative of the general tendency for pitchers to lose velocity over time, a factor which makes the improvements of today's group all the more impressive.
|
MPH Difference, 2015-'13 |
MPH Difference, 2015-'14 |
2015 |
2014 |
2013 |
|
|
0.5 |
0.6 |
94.9 |
94.3 |
94.4 |
|
|
0.5 |
0.7 |
91.4 |
90.7 |
90.9 |
|
|
0.5 |
0.9 |
97.6 |
96.7 |
97.1 |
This first group of pitchers would certainly not qualify under the stricter conditions, and each player's two-year improvement fits the minimum requirement of 0.5 mph. These three players have also rebounded from a 2014 campaign that saw their velocity go down from the previous season, with a 2015 rebound that more than made up the losses from the previous season.
Miller's velocity mirrors his performance, as his breakout campaign of 2013 was followed by an uneven trip through the '14 season, but he rebounded to have an excellent year for the Braves in '15. Though he exhibited a modest improvement that barely met the lowered thresholds for qualification, it is nonetheless encouraging for a young pitcher who relies so heavily on the fastball (67 percent of all pitches last season).
Doubront has spent time in the bullpen throughout his career, such that he barely qualified under the conditions laid forth in the introduction (he had 12 starts in 2015 and 14 starts in '14). The increase in his velo was within range regardless of role, but the impact of that bump was marginalized by the fact that he pitched just 75 1/3 innings this past season.
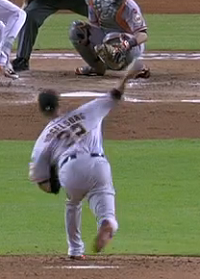
Eovaldi has been one of the more maddening pitchers in the game, with elite velocity that has only grown over time, and the high-octane stuff makes him a perennial breakout candidate, but he continues to struggle to keep runs off the scoreboard despite the jumps in velocity. The biggest leap came in 2013 as his '12 velo was a relatively-modest 95.0 mph, but the ease with which big-league batters square up his heat is a long-term concern for his performance. It could get ugly when the velocity invevitably reverses course.
|
MPH Difference, 2015-'13 |
MPH Difference, 2015-'14 |
2015 |
2014 |
2013 |
|
|
C. Kershaw |
0.8 |
0.5 |
94.2 |
93.7 |
93.4 |
|
0.8 |
0.6 |
92.0 |
91.4 |
91.2 |
|
|
0.8 |
0.8 |
96.3 |
95.5 |
95.5 |
Once again, this group would not qualify if we used the same magnitude for qualification among gainers and losers, and all three players have seen an identical 0.8 mph improvement over the two-year stretch. What separates these pitchers from the previous group is that each player threw as hard or harder in 2014 as they had in '13, marking a multi-year run of velocity improvement.
You may have heard of that Kershaw guy, and it's scary to think that the best pitcher in the game keeps getting better. But such is the case, as not only has his pitch-speed continuously improved over the past few years, but his mechanical efficiency seemingly gets better each season as well, with continual improvements to his stability and his mechanical repetition.
Locke had a rough season in terms of run prevention, with a 4.49 ERA that more than a half-run higher than either of the previous two seasons, but his DIPS peripherals were better than either campaign and resulted in the lowest FIP of his career. He gave up far more hits than any previous season, an aspect over which he has limited influence, but his baseline velocity is low enough that the impact of his improvement was likely marginalized.
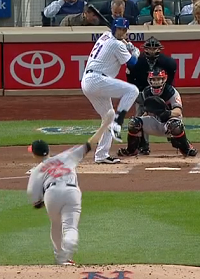
Kelly has been throwing smoke since his Cardinals days, and he does so with solid movement that earns a sinker label from pitch-classification systems. His pitch-speed registered at 95.0 mph in 2012 before leaping a half-tick, and then it held firm for two years before making an even bigger jump last season. Kelly and Eovaldi stand as prime examples that it takes more than raw velocity to vanquish big-league hitters.
|
MPH Difference, 2015-'13 |
MPH Difference, 2015-'14 |
2015 |
2014 |
2013 |
|
|
1.1 |
0.6 |
93.6 |
93.0 |
92.5 |
|
|
1.2 |
0.6 |
95.1 |
94.5 |
93.9 |
|
|
1.4 |
0.5 |
94.9 |
94.4 |
93.5 |
|
|
R. Vogelsong |
1.9 |
0.8 |
91.9 |
91.1 |
90.0 |
The final group represents the handful of pitchers who would have qualified under the original set of rules, with at least a 0.5-mph gain over 2013 and a two-year improvement of a full tick or more. Three of the four pitchers are actually return candidates from the previous year's list, further narrowing the scope of pitchers who have exhibited the rare ability to pump more gas as they age yet making their individual progress even more impressive.
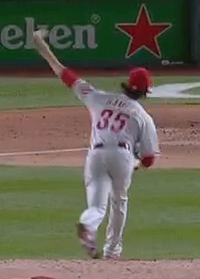
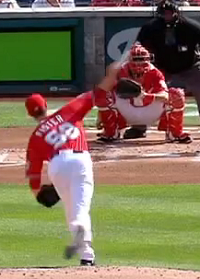
Cole Hamels is the first pitcher who has exhibited three consecutive seasons of year-to-year velocity improvement, essentially gaining a half-tick of velo every season. Such a trend-line denotes consistent gains that helps to quell any fears that he might be taking too large of a jump from season to season, as an excessive velocity bump raises the question of whether that pitcher's arm can withstand the increased forces associated with harder throws. His 2015 velocity was the highest of the southpaw's career, and his other pitches went along for the ride, with his highest career velo ratings of the four-seam, two-seam, changeup, curve, and cutter.
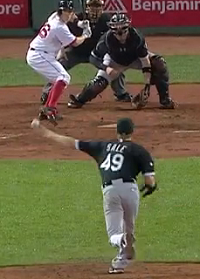
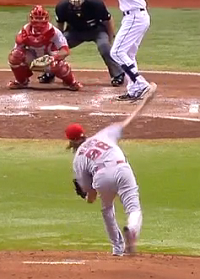
Chris Sale is in the same boat as Hamels, as an elite pitcher whose pitch-speed was higher in 2015 than any previous season of his career. When a pitcher who is already one of the toughest to hit in the majors is mixed with a continuous increase of velocity, then the result is the utter domination that we saw from Sale over this past summer, in which he struck out double-digit batters in eight consecutive starts. Sale's newly discovered pitch-speed fueled the highest strikeout rate in the majors among starting pitchers at 11.8 K's per nine innings, while trailing only 300-K stud Kershaw on both a percentage basis (32.1 percent of opposing batters took the slow walk back to the dugout) and in terms of raw count at 274 punchouts last season. It also smarted a bit extra when he pelted batters with baseballs, which he did a major-league-leading 13 times in 2015.
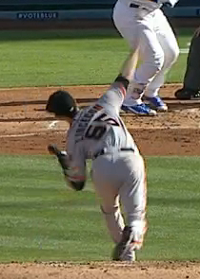
Bud Norris is the third pitcher on this list who also appeared last year, but unlike Hamels and Sale, he is rebounding from a previous decline that put him amongst the 2012 class of pitchers whose dip in velocity ranked among the largest in the game. Norris was used extensively out of the bullpen for the first time in his career, and the shorter stints surely played a role in his velo bump of 2015. Case in point, Norris averaged 94.5 mph on his fastballs through the end of June, at which point he was transitioned from the rotation to relief, and for the rest of the season he averaged 95.8 mph on the heater. The 94.5 mph figure would be right in line with 2014, so he would be unlikely to qualify for the list if not for his shift to the bullpen.
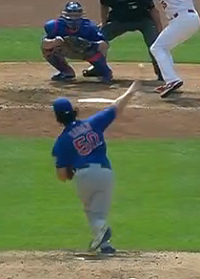
Ryan Vogelsong is another caveat of relief, as he spent more time in the bullpen last season (11 of his 33 games) than in any campaign since 2006. Vogey bounced back and forth between the rotation and the 'pen, with pitch-speed that gained at least a full mph when pitching shorter stints of relief. Combine that with the fact that Vogelsong's average pitch-speed for the entire year was essentially a return to his 2012 velocity – following two years of subpar velo – and the 38-year-old's increase from 2015 loses most of its luster.
***
The Role of Posture
Over the years, I have noted that the pitchers with the biggest dips in velocity tend to have egregious spine-tilt, resulting in poor posture at release point that earn below-average grades on the mechanics report card. On the flipside, the pitchers who experience velocity gains tend to be those with strong posture, and though this observation began as an anecdotal sidenote and has been limited due to small sample size, there is also some functional precedent to an existing relationship. At the National Pitching Association, we noticed a connection between shoulder injury and egregious spine-tilt, while the relationship between shoulder functionality and velocity has long been established. It would stand to reason, then, that pitchers with excessive spine tilt would be expected to have a more difficult time maintaining velocity – let alone gaining it – over the long haul. The effect would be most visible at the extremes, so each year when I look at the velo trends of the previous campaign I make sure to note the posture of the pitchers at each extreme of the pitch-speed spectrum. Let's take a look at the pitchers on both ends of velocity-change to see if we see any additional evidence emerge with this year's group.
First, the velo gainers:
Vogelsong: Posture = 45; Norris: Posture = 50
Sale: Posture = 70; Hamels: Posture = 60
Both Norris and Vogelsong are unimpressive on the posture scale, rating at or just below league-average in terms of spine-tilt near release point. Of course, both of these pitchers had additional caveats that called the legitimacy of their respective velo bumps into question, so perhaps they are not the best examples to evaluate when studying the velocity impact of strong posture.
On the other hand, Hamels and Sale are the rare examples of pitchers who have continued to gain velocity throughout their careers, with each player making multiple appearances on the annual list of velo gainers. These are two aces whose workloads would typically be associated with a decrease in velo, particularly as they age further past their theoretical physical peak. The fact that both southpaws exhibit plus posture (plus-plus in the case of Sale) is another feather in the cap of the theoretical connection between spine-tilt and velocity.
Now let's look at the pitchers whose velo drops were the most egregious last season:
Fister: Posture = 45; Weaver: Posture = 30
Lincecum: Posture = 35; Haren: Posture = 50
Both Weaver and Lincecum serve as examples of extreme spine tilt, falling below the 40 threshold for posture to add further fuel to the fire behind their losses in pitch-speed. Fister is near the league-average, but his delivery has gone through some alterations over the years, and his posture of the past couple of years was worse than it had been previously (I gave him a 55-grade for posture in the 2014 Starting Pitcher Guide). Haren has gone the other direction, with spine-tilt that has lessened as he has neared the end of his career, and previous grades put the posture at below-average (I gave him a 45-grade for posture in the '14 SPG).
The evidence is far from compelling, but once again the biggest droppers suffer from various degrees of spine-tilt while the biggest gains are seen from those pitchers who score well in the posture category of the mechanics report card. The potential for a connection between the velocity and posture grows stronger with each additional year of evidence.
Thank you for reading
This is a free article. If you enjoyed it, consider subscribing to Baseball Prospectus. Subscriptions support ongoing public baseball research and analysis in an increasingly proprietary environment.
Subscribe now