This week's question comes from Robert Shore, who asks:
Like many people, I was mightily impressed by Voros McCracken's work, which strongly suggested that pitchers have essentially no effect on the conversion of balls in play to outs. It occurred to me to wonder about the converse question. Are some batters better than others in converting balls in play to base hits?
This is a question that has come up several times in the past year, since McCracken published his results, and in fact was addressed a bit in a BP Mailbag article.
To restate, McCracken's work shows that, once you remove strikeouts, walks, and home runs (events that the pitcher is solely responsible for), and look only at the results of plate appearances where the defense participates (a ball in play), the range of differences between pitchers is small enough to be negligible in most cases. The difference between the likelihood of a hit off of Pedro Martinez and or Dave Mlicki given that the batter doesn't strike out, walk, or hit a home run, is essentially the same. There's some evidence that pitchers do have minor differentiation in ability to prevent hits on balls in play, but you have to look over several years worth of data to see the trend.
Does the same result hold for batters? Are they equally likely to get a hit once you remove the "Three True Outcomes"? To answer the question, I turned again to the free Lahman database available from www.baseball1.com. I looked for batters who had 300 or more at bats in consecutive seasons, to see if their rate of hits on balls in play (ball-in-play hit rate, or what I'll label BIPr) was consistent from year to year. Note that this will exclude hitters who weren't more or less regulars in two straight seasons, whether due to injury, lack of opportunity or ability, or retirement. In particular, we'd expect that it leaves us with the better hitters in the league–and BIPrs that are higher than the league average–if an ability exists. I further broke down different eras in baseball history, to see how that ability may have changed over time. Data is through 2000.
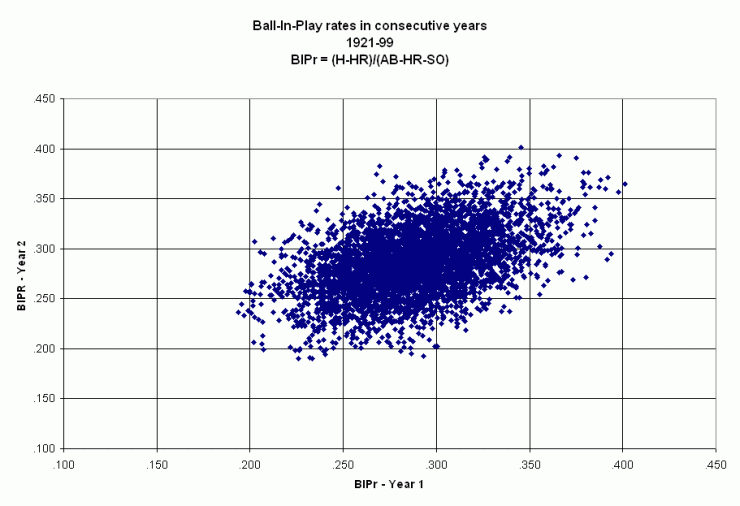
In the post-1893 era (the introduction of the 60'6" pitching distance), the year-to-year correlation of BIPr for regular batters was +0.501. Recalling that 0 indicates no relationship, and +1.00 indicates a perfect linear relationship between the two sets of values, we can see that the ability for batters to create hits on balls in play is much more persistent from year to year than the near-zero correlation in a pitcher's BIPr.
I split up the eras of baseball into (a) pre-1893, (b) 1893-1920, (c) 1921-2000, (d) 1921-1950, and (e) 1951-2000. Note that the (d) and (e) are a further breakdown of (c), as I wanted to isolate the lively ball, pre-WWII game from the 1950-present. I also looked at the 1960's expanded strike zone years, and the subsequent post-expansion period.
Years     Corr Median
1951-2000 0.45  0.285
1921-2000 0.46  0.288
1921-1950 0.44  0.297
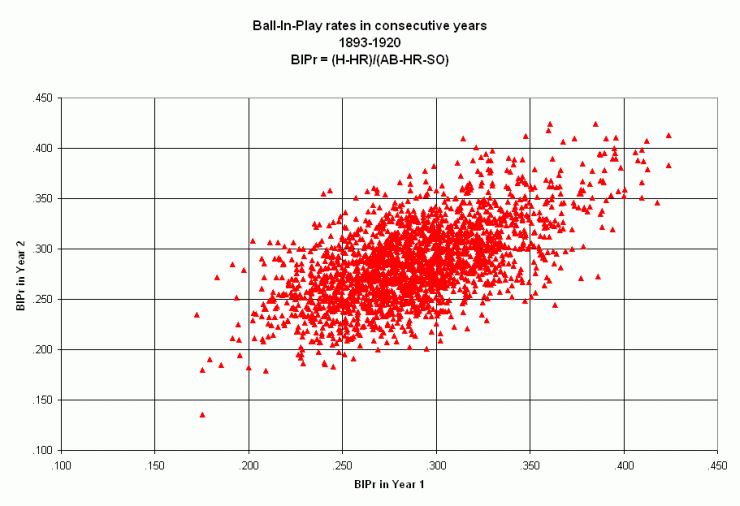
1893-1920 0.61  0.285
pre-1893  0.48  0.282

    Years Corr Median
1969-2000 0.46  0.287
1963-1968 0.41  0.276
There are several interesting things to note here: first, a batter's ability to get hits on balls in play has been a consistent part of the professional game since its inception, with a remarkable cross-era consistency in year-to-year correlation. The one outlier is the 1893-1920 game, where the batter exerted greater influence on the outcome, resulting in a correlation of +0.61. I thought perhaps there was one stretch of time that was skewing the results, but splitting out the 1893-1920 era in the NL-only high -offense years 1893-1900 from the two-league "dead ball" years 1901-1920 yielded almost identical correlations. It seems that batters demonstrated more year to year consistency in getting a hit on a ball in play in those years.
Another fascinating observation is that the median BIPr is remarkably consistent across eras. The median 1950-2000 BIPr is identical to the 19th century BIPr before the introduction of the modern pitching mound. Again, there are interesting exceptions, namely the 1921-1950 era, which had an unusually high .297 median BIPr, and the 1963-68 era, the low point at .276. These, perhaps unsurprisingly, correspond to a high-offense era of the '20s and '30s, and the expanded strike zone and record-low offense of the '60s. Indeed, the 1921-1930 era had a .309 BIPr, the 1930's had a .299 BIPr, and the 1940's fell to a more typical .282 BIPr. The regular batters of the '20s and '30s not only started the love affair with the home run, but they also tore into opposing defenses at rates unseen in any other time.
These results may be easier to visualize through a chart. The following two charts show the year-to-year relationship in BIPr for regular batters. The first is for 1921-99, the latter for 1893-1920. Two things to look for are that the scatter plots are not symmetrical, but are somewhat flattened, like an oval. If they were round, it would indicate that a value in year 1 had no predictive value for the value in year 2, i.e., there's no ability being shown, which is very close to what we see for pitchers' BIPr. The degree to which the point form a straight line (along the center of the oval), indicates the strength of the relationship, or, how much the value in one year helps predict the value in the other. The red dots form a "flatter" shape than the blue, reflecting the higher correlation mentioned above for the 1893-1920 era.


Thank you for reading
This is a free article. If you enjoyed it, consider subscribing to Baseball Prospectus. Subscriptions support ongoing public baseball research and analysis in an increasingly proprietary environment.
Subscribe now