Wouldn't we expect BABIP rates to go down, as HR rates go down? As baseball evolved to where everyone hit homeruns, pitchers evolved towards going for more strikeouts, and BABIPs went up a bit. Now with the reverse happening, we are seeing lower K rates and lower BABIPs. I guess it wouldn't be too hard to come up with what might be some just-so stories as to why, but it seems pitching is evolving back toward what it was in my youth, with a lot of pitchers throwing four or five pitches, mixing things up, changing speeds and location as opposed to blowing it by people. I expect we'll see more guys who don't, or barely, break 90 in the future.
Has the overall HR/FB rate moved much in the last few years? My guess (and I'm too lazy to do the work myself) is that two things contributed – 1- most of the newest ballparks lean toward the pitchers, after an era when most new parks favored hitters, and 2 (more important)- there are more banjo-hitting types now, after an era when there were very few. This has led to an environment that has a lower HR/FB rate MLB-wide (prediction), and thus provided a greater niche for low-K pitchers. I don't know if a lower BABIP is driven by a lower BABIP on fly balls, or – more likely – are a more "organic" – hate that term – outgrowth of the newer, more old-style pitching patterns on display.
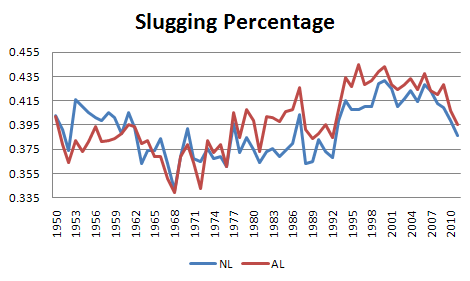
That question came from user MikeW in a comment to my piece on how batting average on balls in play fluctuates by age group. The timing of that question was quite appropriate because I was already kicking around the concept in my head as I prepared for this column after a conversation with a good friend of mine. We were speculating whether pitchers could afford to be more authoritative within the strike zone as middle infielders were no longer hitting 400 foot missiles out of ballparks. That conversation was generated from the article from this time last week that showed how league-wide slugging percentages were in a decline for both leagues over the past few seasons.
Has the overall HR/FB rate moved much in the last few years? Yes, it actually has and is indeed in a downward trend in recent seasons as the chart below illustrates.
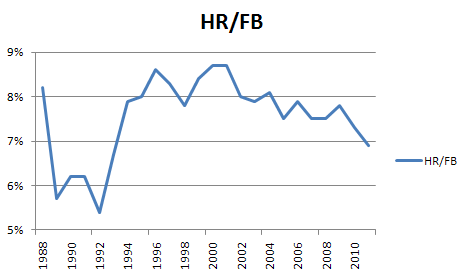
It remains to be seen if that rate will continue a decline toward the time between the live ball year of 1987 and the combined beginning of the expansion and enhancement era in the mid 1990’s. There could be a myriad of explanations to explain this depending on your point-of-view, ranging from stricter drug testing to changing park dimensions to the increased use of the cut-fastball. It could also be a healthy mix of any combination of those factors, but fly balls are not traveling as far as they did just ten seasons ago.
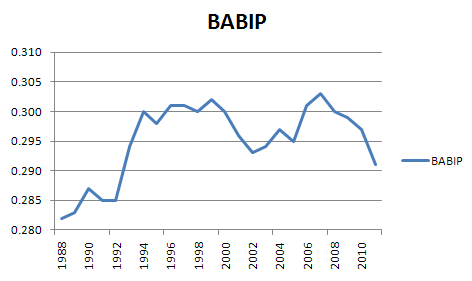
The same decline in power that is decreasing the amount of fly balls that are leaving the yard could also be affecting the number of batted balls that are getting past defenders as BABIP is also in a decline in recent years, albeit a bit more erratically than HR/FB rates are.
Given those two pieces of information, I thought that we would find that pitchers on the whole were throwing a greater percentage of strikes than in seasons past. In 2011, 74 pitchers in baseball have walk rates of 3.0 or less with at least 60 innings pitched. If one jumps back just one season and doubles that innings benchmark, though, only 66 pitchers had walk rates of 3.0 or less. Going back to 2009 with that same criteria, we find 59 pitchers, and 65 pitchers in 2008. Despite this, the league average percentage of strikes thrown since 1988 has remained extremely constant, ranging from 61 to 63 percent. Since the 2001 season, it has stayed between 62 and 63 percent, so any increase in strike throwing has been slight, at best.
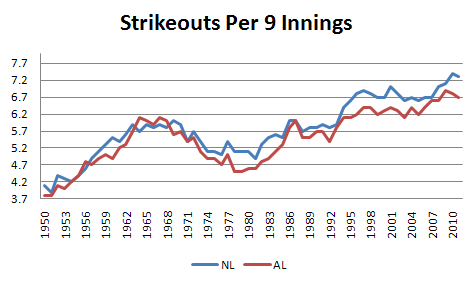
The only other downward trending metric that would support the initial hypothesis is that the league-wide contact rate is down slightly. From 1994 to 2002, major league hitters put pitches in play 80 percent of the time. There was a spike up to 81 percent in 2003 and 2005, but since that season, league-wide contact rates have been 80 percent or lower and have been at 79 percent since the start of the 2010 season. This goes hand-in-hand with the data from last week that shows how pitching strikeout rates have continued improving going on 30 seasons now with very little slippage. In that time, both the cut fastball and the split-fingered fastball before it were frequently employed, and increased bullpen use by matchup-minded managers has helped lead to strikeout rates continuing to grow.
Lastly, we come to the plate appearances themselves. Follow a baseball hashtag on Twitter and you are very likely to see complaints about teams walking too much or not walking enough, but there is no arguing that players are increasingly seeing more pitches per plate appearances.
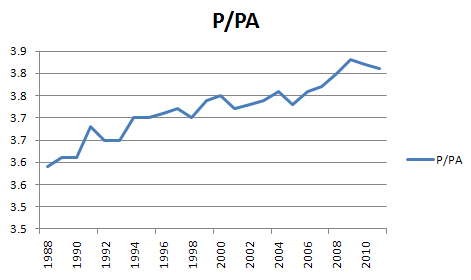
From 1998 to 1990, the league saw just 3.6 pitches per plate appearance, and during that time, there were 21 instances of pitchers throwing at least ten complete games in a single season, led by Danny Jackson and Orel Hershiser, who each had 15 complete games in 1988. Fast-forward to the past three complete seasons and batters are seeing 0.2 more pitches per plate appearance, and CC Sabathia is the only pitcher over the past three seasons that has as many as ten complete games in a single season. Despite the fact that hitters are getting more opportunities to produce desirable outcomes, hitters are hitting fewer home runs, fewer extra base hits, making less contact, and hitting fewer balls into play safely than they were just five seasons ago.
This season, we read about the Twins and Francisco Liriano in regards to “pitching to contact” and witness others such as Wade Davis, Carl Pavano, Kevin Correia, Charlie Morton, and Dustin Moseley also sacrifice strikeouts for defense-driven outs with some finding more success than others. Pitching to contact does not mean these pitchers are simply throwing the ball over the plate and letting batters dictate the action. Rather, it is an intentional effort to put hitters into swing mode to potentially get the pitcher into favorable counts earlier in a plate appearance–a place where the pitcher has a distinct advantage against a batter. In 2011, pitchers are holding opposing hitters to a .205 batting average when the pitcher is ahead in the count with just a .525 OPS. When the pitcher lets the batter get ahead in the count, those numbers jump up to .292 and 945.
Tampa Bay Rays manager Joe Maddon refers to this as Pitching 2.0 in his pre and post-game chats, and the upgrade from 1.0 to 2.0 requires the swing mode plug-in. That is best exemplified by James Shields, who leads the American League in both strikeouts and in swinging strikes despite only one plus pitch. Five plus years ago, encouraging pitchers to take this approach may have been setting them up to fail, but the new supporting data appears to give more pitchers the confidence to once again challenge hitters rather than working the fringes of the zone and hoping the ninth slot hitter does not hit one 420 feet to the opposite field.
Thank you for reading
This is a free article. If you enjoyed it, consider subscribing to Baseball Prospectus. Subscriptions support ongoing public baseball research and analysis in an increasingly proprietary environment.
Subscribe now