| Player | Player Sort | Pos | Salary | Salary Sort | Pct | Pct Sort | WARP | WARP Sort | WARP/$M | WARP/$M Sort | $/WARP | $/WARP Sort | Current Status |
|---|
 Jayson Werth
 |
Werth Jayson |
RF |
$13,571,429 |
13571429 |
14.67% |
14.67 |
2.40 |
2.39615 |
0.18 |
0.1765584154771 |
$5,663,848 |
5663847.8392421 |
|
 Ryan Zimmerman
 |
Zimmerman Ryan |
3B |
$12,100,000 |
12100000 |
13.08% |
13.08 |
4.67 |
4.66847 |
0.39 |
0.38582396694215 |
$2,591,856 |
2591855.5758096 |
|
 Edwin Jackson
 |
Jackson Edwin |
RP |
$11,000,000 |
11000000 |
11.89% |
11.89 |
3.58 |
3.58154 |
0.33 |
0.32559454545455 |
$3,071,305 |
3071304.5226355 |
|
 Adam LaRoche
 |
LaRoche Adam |
1B |
$8,000,000 |
8000000 |
8.65% |
8.65 |
4.24 |
4.23818 |
0.53 |
0.5297725 |
$1,887,603 |
1887602.6973843 |
|
 John Lannan
 |
Lannan John |
RP |
$5,000,000 |
5000000 |
5.40% |
5.40 |
-0.27 |
-0.267808 |
— |
0 |
— |
0 |
|
 Stephen Strasburg
 |
Strasburg Stephen |
RP |
$4,875,000 |
4875000 |
5.27% |
5.27 |
5.93 |
5.93268 |
1.22 |
1.21696 |
$821,720 |
821719.69497765 |
|
 Chien-Ming Wang
 |
Wang Chien-Ming |
RP |
$4,000,000 |
4000000 |
4.32% |
4.32 |
-0.64 |
-0.641963 |
— |
0 |
— |
0 |
|
 Michael Morse
 |
Morse Michael |
LF |
$3,500,000 |
3500000 |
3.78% |
3.78 |
0.36 |
0.361611 |
0.10 |
0.10331742857143 |
$9,678,909 |
9678909.1039819 |
|
 Gio González
 |
Gonzalez Gio |
RP |
$3,350,000 |
3350000 |
3.62% |
3.62 |
5.33 |
5.32591 |
1.59 |
1.589823880597 |
$629,000 |
629000.4900571 |
|
 Tom Gorzelanny
 |
Gorzelanny Tom |
RP |
$3,000,000 |
3000000 |
3.24% |
3.24 |
0.40 |
0.401191 |
0.13 |
0.13373033333333 |
$7,477,735 |
7477735.0439068 |
|
 Sean Burnett
 |
Burnett Sean |
RP |
$2,300,000 |
2300000 |
2.49% |
2.49 |
1.05 |
1.04607 |
0.45 |
0.45481304347826 |
$2,198,706 |
2198705.6315543 |
|
 Jordan Zimmermann
 |
Zimmermann Jordan |
RP |
$2,300,000 |
2300000 |
2.49% |
2.49 |
4.85 |
4.85483 |
2.11 |
2.1107956521739 |
$473,755 |
473755.00274984 |
|
 Yunesky Maya
 |
Maya Yunesky |
DNP |
$2,000,000 |
2000000 |
2.16% |
2.16 |
— |
0.00 |
— |
0 |
— |
0 |
|
 Anthony Rendon
 |
Rendon Anthony |
DNP |
$1,800,000 |
1800000 |
1.95% |
1.95 |
— |
0.00 |
— |
0 |
— |
0 |
|
 Bryce Harper
 |
Harper Bryce |
CF |
$1,750,000 |
1750000 |
1.89% |
1.89 |
5.17 |
5.16752 |
2.95 |
2.9528685714286 |
$338,654 |
338653.74492987 |
|
 Tyler Clippard
 |
Clippard Tyler |
RP |
$1,650,000 |
1650000 |
1.78% |
1.78 |
1.04 |
1.03605 |
0.63 |
0.62790909090909 |
$1,592,587 |
1592587.230346 |
|
 Rick Ankiel
 |
Ankiel Rick |
CF |
$1,250,000 |
1250000 |
1.35% |
1.35 |
0.54 |
0.535831 |
0.43 |
0.4286648 |
$2,332,825 |
2332825.0885074 |
|
 Matt Purke
 |
Purke Matt |
DNP |
$1,037,500 |
1037500 |
1.12% |
1.12 |
— |
0.00 |
— |
0 |
— |
0 |
|
 Brad Lidge
 |
Lidge Brad |
RP |
$1,000,000 |
1000000 |
1.08% |
1.08 |
0.05 |
0.0512771 |
0.05 |
0.0512771 |
$19,501,883 |
19501882.906795 |
|
 Jesus Flores
 |
Flores Jesus |
C |
$815,000 |
815000 |
0.88% |
0.88 |
-0.58 |
-0.584785 |
— |
0 |
— |
0 |
|
 Mark DeRosa
 |
DeRosa Mark |
PH |
$800,000 |
800000 |
0.86% |
0.86 |
-0.49 |
-0.494613 |
— |
0 |
— |
0 |
|
 Chad Tracy
 |
Tracy Chad |
PH |
$750,000 |
750000 |
0.81% |
0.81 |
0.49 |
0.489129 |
0.65 |
0.652172 |
$1,533,338 |
1533337.8311243 |
|
 Xavier Nady
 |
Nady Xavier |
LF |
$700,000 |
700000 |
0.76% |
0.76 |
-1.06 |
-1.05633 |
— |
0 |
— |
0 |
|
 Brett Carroll
 |
Carroll Brett |
CF |
$580,000 |
580000 |
0.63% |
0.63 |
-0.11 |
-0.10545 |
— |
0 |
— |
0 |
|
 Ian Desmond
 |
Desmond Ian |
SS |
$512,500 |
512500 |
0.55% |
0.55 |
1.80 |
1.80067 |
3.51 |
3.5135024390244 |
$284,616 |
284616.28171736 |
|
 Danny Espinosa
 |
Espinosa Danny |
2B |
$506,000 |
506000 |
0.55% |
0.55 |
2.06 |
2.06305 |
4.08 |
4.0771739130435 |
$245,268 |
245267.92855239 |
|
 Drew Storen
 |
Storen Drew |
RP |
$498,750 |
498750 |
0.54% |
0.54 |
0.44 |
0.44041 |
0.88 |
0.88302756892231 |
$1,132,467 |
1132467.4734906 |
|
 Roger Bernadina
 |
Bernadina Roger |
LF |
$493,500 |
493500 |
0.53% |
0.53 |
1.45 |
1.45148 |
2.94 |
2.9411955420466 |
$339,998 |
339997.79535371 |
|
 Wilson Ramos
 |
Ramos Wilson |
C |
$491,250 |
491250 |
0.53% |
0.53 |
0.81 |
0.814173 |
1.66 |
1.6573496183206 |
$603,373 |
603372.99320906 |
|
 Henry Rodriguez
 |
Rodriguez Henry |
RP |
$491,000 |
491000 |
0.53% |
0.53 |
0.27 |
0.269306 |
0.55 |
0.54848472505092 |
$1,823,205 |
1823204.8301932 |
|
 Craig Stammen
 |
Stammen Craig |
RP |
$485,000 |
485000 |
0.52% |
0.52 |
1.07 |
1.07063 |
2.21 |
2.2074845360825 |
$453,004 |
453004.30587598 |
|
 Ross Detwiler
 |
Detwiler Ross |
RP |
$485,000 |
485000 |
0.52% |
0.52 |
0.18 |
0.184887 |
0.38 |
0.38121030927835 |
$2,623,224 |
2623223.9151482 |
|
 Ryan Mattheus
 |
Mattheus Ryan |
RP |
$481,000 |
481000 |
0.52% |
0.52 |
-0.71 |
-0.708426 |
— |
0 |
— |
0 |
|
 Chris Marrero
 |
Marrero Chris |
DNP |
$481,000 |
481000 |
0.52% |
0.52 |
— |
0.00 |
— |
0 |
— |
0 |
|
 Steve Lombardozzi
 |
Lombardozzi Steve |
2B |
$481,000 |
481000 |
0.52% |
0.52 |
0.80 |
0.801136 |
1.67 |
1.6655634095634 |
$600,397 |
600397.43564139 |
|
| Year | Nationals payroll |
PR Sort |
Avg payroll |
AvgPR Sort |
Diff |
Diff Sort |
|---|
| 2005 | $48,613,000 | 48613000 | $73,628,169 | 73628169 | $-25,015,169 | -25015169 |
| 2006 | $62,520,000 | 62520000 | $81,192,832 | 81192832 | $-18,672,832 | -18672832 |
| 2007 | $37,347,500 | 37347500 | $85,747,487 | 85747487 | $-48,399,987 | -48399987 |
| 2008 | $56,261,000 | 56261000 | $93,079,041 | 93079041 | $-36,818,041 | -36818041 |
| 2009 | $59,878,000 | 59878000 | $92,957,049 | 92957049 | $-33,079,049 | -33079049 |
| 2010 | $65,275,000 | 65275000 | $94,957,956 | 94957956 | $-29,682,956 | -29682956 |
| 2011 | $70,794,429 | 70794429 | $97,426,414 | 97426414 | $-26,631,985 | -26631985 |
| 2012 | $92,534,929 | 92534929 | $100,689,500 | 100689500 | $-8,154,571 | -8154571 |
| 2013 | $121,289,679 | 121289679 | $106,658,387 | 106658387 | $14,631,292 | 14631292 |
| 2014 | $137,356,579 | 137356579 | $115,428,670 | 115428670 | $21,927,909 | 21927909 |
| 2015 | $162,014,559 | 162014559 | $125,458,486 | 125458486 | $36,556,073 | 36556073 |
| 2016 | $145,178,886 | 145178886 | $130,290,910 | 130290910 | $14,887,976 | 14887976 |
| 2017 | $164,335,444 | 164335444 | $136,573,000 | 136573000 | $27,762,444 | 27762444 |
| 2018 | $180,849,056 | 180849056 | $135,681,867 | 135681867 | $45,167,189 | 45167189 |
| 2019 | $197,203,691 | 197203691 | $134,776,225 | 134776225 | $62,427,466 | 62427466 |
| 2020 | $173,754,795 | 173754795 | $138,321,485 | 138321485 | $35,433,310 | 35433310 |
| 2021 | $172,772,247 | 172772247 | $129,635,938 | 129635938 | $43,136,309 | 43136309 |
| 2022 | $137,371,867 | 137371867 | $147,002,411 | 147002411 | $-9,630,544 | -9630544 |
| 2023 | $125,965,667 | 125965667 | $158,155,877 | 158155877 | $-32,190,210 | -32190210 |
| 2024 | $113,041,666 | 113041666 | $133,074,721 | 133074721 | $-20,033,055 | -20033055 |
| 2025 | $42,875,000 | 42875000 | $94,180,059 | 94180059 | $-51,305,059 | -51305059 |
| 2026 | $40,375,000 | 40375000 | $74,818,461 | 74818461 | $-34,443,461 | -34443461 |
| 2027 | $5,375,000 | 5375000 | $56,972,319 | 56972319 | $-51,597,319 | -51597319 |
| 2028 | $7,375,000 | 7375000 | $45,437,759 | 45437759 | $-38,062,759 | -38062759 |
| 2029 | $9,375,000 | 9375000 | $37,269,628 | 37269628 | $-27,894,628 | -27894628 |
| 2030 | $9,375,000 | 9375000 | $39,665,769 | 39665769 | $-30,290,769 | -30290769 |
|
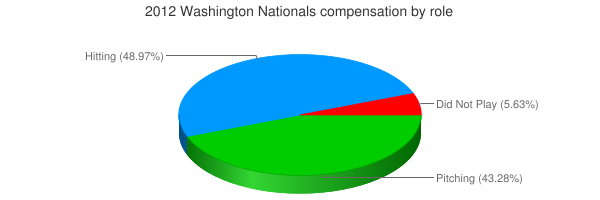
 2012 Washington Nationals