| Player | Player Sort | Pos | Salary | Salary Sort | Pct | Pct Sort | WARP | WARP Sort | WARP/$M | WARP/$M Sort | $/WARP | $/WARP Sort | Current Status |
|---|
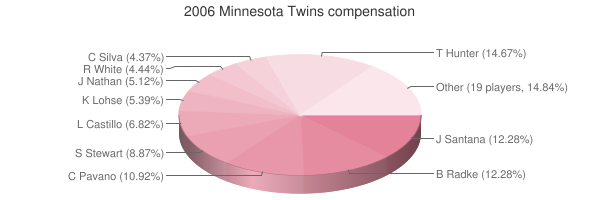
 Torii Hunter
 |
Hunter Torii |
CF |
$10,750,000 |
10750000 |
16.53% |
16.53 |
2.60 |
2.59813 |
0.24 |
0.24168651162791 |
$4,137,591 |
4137591.2675655 |
|
 Brad Radke
 |
Radke Brad |
RP |
$9,000,000 |
9000000 |
13.84% |
13.84 |
-0.14 |
-0.135823 |
— |
0 |
— |
0 |
|
 Johan Santana
 |
Santana Johan |
RP |
$8,750,000 |
8750000 |
13.46% |
13.46 |
8.00 |
7.99816 |
0.91 |
0.91407542857143 |
$1,094,002 |
1094001.6203727 |
|
 Shannon Stewart
 |
Stewart Shannon |
LF |
$6,500,000 |
6500000 |
10.00% |
10.00 |
-0.08 |
-0.0795549 |
— |
0 |
— |
0 |
|
 Luis Castillo
 |
Castillo Luis |
2B |
$5,000,000 |
5000000 |
7.69% |
7.69 |
0.08 |
0.0846374 |
0.02 |
0.01692748 |
$59,075,539 |
59075538.709837 |
|
 Kyle Lohse
 |
Lohse Kyle |
RP |
$3,950,000 |
3950000 |
6.07% |
6.07 |
0.46 |
0.461498 |
0.12 |
0.11683493670886 |
$8,559,084 |
8559083.6796692 |
|
 Joe Nathan
 |
Nathan Joe |
RP |
$3,750,000 |
3750000 |
5.77% |
5.77 |
2.45 |
2.45156 |
0.65 |
0.65374933333333 |
$1,529,638 |
1529638.2711416 |
|
 Rondell White
 |
White Rondell |
DH |
$3,250,000 |
3250000 |
5.00% |
5.00 |
-1.27 |
-1.2722 |
— |
0 |
— |
0 |
|
 Carlos Silva
 |
Silva Carlos |
RP |
$3,200,000 |
3200000 |
4.92% |
4.92 |
-2.27 |
-2.27273 |
— |
0 |
— |
0 |
|
 Michael Cuddyer
 |
Cuddyer Michael |
RF |
$1,300,000 |
1300000 |
2.00% |
2.00 |
2.31 |
2.30516 |
1.77 |
1.7732 |
$563,952 |
563952.1768554 |
|
 Tony Batista
 |
Batista Tony |
3B |
$1,250,000 |
1250000 |
1.92% |
1.92 |
-0.37 |
-0.368942 |
— |
0 |
— |
0 |
|
 Juan Castro
 |
Castro Juan |
SS |
$1,000,000 |
1000000 |
1.54% |
1.54 |
-0.49 |
-0.487805 |
— |
0 |
— |
0 |
|
 Mike Redmond
 |
Redmond Mike |
C |
$900,000 |
900000 |
1.38% |
1.38 |
0.50 |
0.502789 |
0.56 |
0.55865444444444 |
$1,790,015 |
1790015.2946862 |
|
 Juan Rincon
 |
Rincon Juan |
RP |
$900,000 |
900000 |
1.38% |
1.38 |
1.93 |
1.92586 |
2.14 |
2.1398444444444 |
$467,324 |
467323.68915705 |
|
 Nick Punto
 |
Punto Nick |
3B |
$690,000 |
690000 |
1.06% |
1.06 |
1.77 |
1.7743 |
2.57 |
2.5714492753623 |
$388,886 |
388885.75776363 |
|
 Dennys Reyes
 |
Reyes Dennys |
RP |
$550,000 |
550000 |
0.85% |
0.85 |
1.41 |
1.41206 |
2.57 |
2.5673818181818 |
$389,502 |
389501.86252709 |
|
 Lew Ford
 |
Ford Lew |
LF |
$425,000 |
425000 |
0.65% |
0.65 |
-0.51 |
-0.514872 |
— |
0 |
— |
0 |
|
 Ruben Sierra
 |
Sierra Ruben |
DH |
$400,000 |
400000 |
0.62% |
0.62 |
-0.15 |
-0.149823 |
— |
0 |
— |
0 |
|
 Joe Mauer
 |
Mauer Joe |
C |
$400,000 |
400000 |
0.62% |
0.62 |
7.62 |
7.62357 |
19.06 |
19.058925 |
$52,469 |
52468.856454391 |
|
 Justin Morneau
 |
Morneau Justin |
1B |
$385,000 |
385000 |
0.59% |
0.59 |
3.54 |
3.53726 |
9.19 |
9.1876883116883 |
$108,841 |
108841.30654801 |
|
 Jesse Crain
 |
Crain Jesse |
RP |
$361,000 |
361000 |
0.56% |
0.56 |
1.70 |
1.69932 |
4.71 |
4.7072576177285 |
$212,438 |
212437.91634301 |
|
 Matt Guerrier
 |
Guerrier Matt |
RP |
$343,500 |
343500 |
0.53% |
0.53 |
0.39 |
0.389003 |
1.13 |
1.1324687045124 |
$883,027 |
883026.60904929 |
|
 Luis Antonio Rodriguez
 |
Rodriguez Luis Antonio |
3B |
$332,000 |
332000 |
0.51% |
0.51 |
-0.18 |
-0.179804 |
— |
0 |
— |
0 |
|
 Scott Baker
 |
Baker Scott |
RP |
$330,000 |
330000 |
0.51% |
0.51 |
0.07 |
0.0672258 |
0.20 |
0.20371454545455 |
$4,908,830 |
4908829.645761 |
|
 Jason Kubel
 |
Kubel Jason |
LF |
$327,000 |
327000 |
0.50% |
0.50 |
-1.23 |
-1.22831 |
— |
0 |
— |
0 |
|
 Francisco Liriano
 |
Liriano Francisco |
RP |
$327,000 |
327000 |
0.50% |
0.50 |
4.32 |
4.32086 |
13.21 |
13.213639143731 |
$75,679 |
75679.378642215 |
|
 Dave Gassner
 |
Gassner Dave |
DNP |
$327,000 |
327000 |
0.50% |
0.50 |
— |
0.00 |
— |
0 |
— |
0 |
|
 Willie Eyre
 |
Eyre Willie |
RP |
$327,000 |
327000 |
0.50% |
0.50 |
-1.03 |
-1.03124 |
— |
0 |
— |
0 |
|
| Year | Twins payroll |
PR Sort |
Avg payroll |
AvgPR Sort |
Diff |
Diff Sort |
|---|
| 1984 | $50,000 | 50000 | $260,000 | 260000 | $-210,000 | -210000 |
| 1985 | $130,000 | 130000 | $437,500 | 437500 | $-307,500 | -307500 |
| 1986 | $265,000 | 265000 | $552,000 | 552000 | $-287,000 | -287000 |
| 1987 | $465,000 | 465000 | $589,500 | 589500 | $-124,500 | -124500 |
| 1988 | $1,210,000 | 1210000 | $732,083 | 732083 | $477,917 | 477917 |
| 1989 | $2,050,000 | 2050000 | $862,714 | 862714 | $1,187,286 | 1187286 |
| 1990 | $2,700,000 | 2700000 | $1,203,571 | 1203571 | $1,496,429 | 1496429 |
| 1991 | $3,000,000 | 3000000 | $1,884,642 | 1884642 | $1,115,358 | 1115358 |
| 1992 | $3,300,000 | 3300000 | $2,356,071 | 2356071 | $943,929 | 943929 |
| 1993 | $5,200,000 | 5200000 | $3,410,000 | 3410000 | $1,790,000 | 1790000 |
| 1994 | $5,200,000 | 5200000 | $3,911,904 | 3911904 | $1,288,096 | 1288096 |
| 1995 | $6,200,000 | 6200000 | $5,208,333 | 5208333 | $991,667 | 991667 |
| 1996 | $6,200,000 | 6200000 | $4,583,416 | 4583416 | $1,616,584 | 1616584 |
| 1997 | $7,200,000 | 7200000 | $4,892,222 | 4892222 | $2,307,778 | 2307778 |
| 2000 | $16,542,500 | 16542500 | $56,164,089 | 56164089 | $-39,621,589 | -39621589 |
| 2001 | $23,930,000 | 23930000 | $65,991,638 | 65991638 | $-42,061,638 | -42061638 |
| 2002 | $39,950,000 | 39950000 | $68,244,471 | 68244471 | $-28,294,471 | -28294471 |
| 2003 | $55,275,000 | 55275000 | $71,318,479 | 71318479 | $-16,043,479 | -16043479 |
| 2004 | $53,815,000 | 53815000 | $70,466,961 | 70466961 | $-16,651,961 | -16651961 |
| 2005 | $56,556,000 | 56556000 | $73,264,780 | 73264780 | $-16,708,780 | -16708780 |
| 2006 | $65,024,500 | 65024500 | $79,051,754 | 79051754 | $-14,027,254 | -14027254 |
| 2007 | $72,189,500 | 72189500 | $83,931,138 | 83931138 | $-11,741,638 | -11741638 |
| 2008 | $61,442,667 | 61442667 | $90,812,373 | 90812373 | $-29,369,706 | -29369706 |
| 2009 | $67,027,267 | 67027267 | $91,093,211 | 91093211 | $-24,065,944 | -24065944 |
| 2010 | $98,159,167 | 98159167 | $93,373,681 | 93373681 | $4,785,486 | 4785486 |
| 2011 | $113,237,000 | 113237000 | $96,102,034 | 96102034 | $17,134,966 | 17134966 |
| 2012 | $100,431,000 | 100431000 | $100,657,138 | 100657138 | $-226,138 | -226138 |
| 2013 | $82,010,000 | 82010000 | $109,024,990 | 109024990 | $-27,014,990 | -27014990 |
| 2014 | $92,874,836 | 92874836 | $117,828,782 | 117828782 | $-24,953,946 | -24953946 |
| 2015 | $108,262,500 | 108262500 | $127,404,244 | 127404244 | $-19,141,744 | -19141744 |
| 2016 | $105,333,700 | 105333700 | $132,219,407 | 132219407 | $-26,885,707 | -26885707 |
| 2017 | $108,102,500 | 108102500 | $137,302,894 | 137302894 | $-29,200,394 | -29200394 |
| 2018 | $128,713,226 | 128713226 | $136,929,168 | 136929168 | $-8,215,942 | -8215942 |
| 2019 | $119,651,933 | 119651933 | $136,944,257 | 136944257 | $-17,292,324 | -17292324 |
| 2020 | $131,799,311 | 131799311 | $140,677,788 | 140677788 | $-8,878,477 | -8878477 |
| 2021 | $131,678,167 | 131678167 | $132,162,631 | 132162631 | $-484,464 | -484464 |
| 2022 | $141,020,356 | 141020356 | $149,374,046 | 149374046 | $-8,353,690 | -8353690 |
| 2023 | $154,063,740 | 154063740 | $160,460,390 | 160460390 | $-6,396,650 | -6396650 |
| 2024 | $108,346,590 | 108346590 | $135,504,022 | 135504022 | $-27,157,432 | -27157432 |
| 2025 | $96,981,190 | 96981190 | $96,417,302 | 96417302 | $563,888 | 563888 |
| 2026 | $70,726,190 | 70726190 | $76,694,120 | 76694120 | $-5,967,930 | -5967930 |
| 2027 | $68,726,190 | 68726190 | $58,935,617 | 58935617 | $9,790,573 | 9790573 |
| 2028 | $46,476,190 | 46476190 | $45,437,759 | 45437759 | $1,038,431 | 1038431 |
|
 2006 Minnesota Twins