| Player | Player Sort | Pos | Salary | Salary Sort | Pct | Pct Sort | WARP | WARP Sort | WARP/$M | WARP/$M Sort | $/WARP | $/WARP Sort | Current Status |
|---|
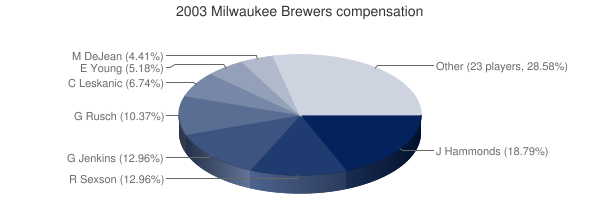
 Jeffrey Hammonds
 |
Hammonds Jeffrey |
RF |
$8,200,000 |
8200000 |
19.97% |
19.97 |
-0.42 |
-0.415049 |
— |
0 |
— |
0 |
|
 Richie Sexson
 |
Sexson Richie |
1B |
$5,125,000 |
5125000 |
12.48% |
12.48 |
4.42 |
4.42379 |
0.86 |
0.86317853658537 |
$1,158,509 |
1158508.8803944 |
|
 Geoff Jenkins
 |
Jenkins Geoff |
LF |
$5,000,000 |
5000000 |
12.18% |
12.18 |
2.47 |
2.474 |
0.49 |
0.4948 |
$2,021,019 |
2021018.5933711 |
|
 Glendon Rusch
 |
Rusch Glendon |
RP |
$4,000,000 |
4000000 |
9.74% |
9.74 |
0.39 |
0.394962 |
0.10 |
0.0987405 |
$10,127,557 |
10127556.575063 |
|
 Curt Leskanic
 |
Leskanic Curt |
RP |
$3,700,000 |
3700000 |
9.01% |
9.01 |
0.21 |
0.213548 |
0.06 |
0.057715675675676 |
$17,326,315 |
17326315.395134 |
|
 Eric Young
 |
Young Eric |
2B |
$2,000,000 |
2000000 |
4.87% |
4.87 |
1.47 |
1.4714 |
0.74 |
0.7357 |
$1,359,250 |
1359249.6941688 |
|
 Mike DeJean
 |
DeJean Mike |
RP |
$1,700,000 |
1700000 |
4.14% |
4.14 |
0.35 |
0.345665 |
0.20 |
0.20333235294118 |
$4,918,056 |
4918056.4997903 |
|
 Royce Clayton
 |
Clayton Royce |
SS |
$1,500,000 |
1500000 |
3.65% |
3.65 |
-0.61 |
-0.611591 |
— |
0 |
— |
0 |
|
 Todd Ritchie
 |
Ritchie Todd |
RP |
$1,150,000 |
1150000 |
2.80% |
2.80 |
0.14 |
0.142723 |
0.12 |
0.12410695652174 |
$8,057,566 |
8057566.0545252 |
|
 Valerio De Los Santos
 |
De Los Santos Valerio |
RP |
$925,000 |
925000 |
2.25% |
2.25 |
-0.19 |
-0.187308 |
— |
0 |
— |
0 |
|
 Wes Helms
 |
Helms Wes |
3B |
$575,000 |
575000 |
1.40% |
1.40 |
1.39 |
1.38975 |
2.42 |
2.4169565217391 |
$413,743 |
413743.47904299 |
|
 John Vander Wal
 |
Vander Wal John |
RF |
$550,000 |
550000 |
1.34% |
1.34 |
1.58 |
1.57856 |
2.87 |
2.8701090909091 |
$348,419 |
348418.8120819 |
|
 Eddie Pérez
 |
Perez Eddie |
C |
$500,000 |
500000 |
1.22% |
1.22 |
-1.00 |
-1.00195 |
— |
0 |
— |
0 |
|
 Keith Osik
 |
Osik Keith |
C |
$455,000 |
455000 |
1.11% |
1.11 |
0.88 |
0.877365 |
1.93 |
1.9282747252747 |
$518,598 |
518598.30287281 |
|
 Dan Kolb
 |
Kolb Dan |
RP |
$450,000 |
450000 |
1.10% |
1.10 |
0.71 |
0.709206 |
1.58 |
1.5760133333333 |
$634,512 |
634512.39837226 |
|
 Ben Sheets
 |
Sheets Ben |
RP |
$428,000 |
428000 |
1.04% |
1.04 |
4.35 |
4.34509 |
10.15 |
10.152079439252 |
$98,502 |
98501.987300608 |
|
 Doug Davis
 |
Davis Doug |
RP |
$427,500 |
427500 |
1.04% |
1.04 |
-0.66 |
-0.66342 |
— |
0 |
— |
0 |
|
 Luis Vizcaino
 |
Vizcaino Luis |
RP |
$370,000 |
370000 |
0.90% |
0.90 |
0.34 |
0.335502 |
0.91 |
0.90676216216216 |
$1,102,825 |
1102825.0204172 |
|
 Alex Sanchez
 |
Sanchez Alex |
CF |
$340,000 |
340000 |
0.83% |
0.83 |
0.14 |
0.136515 |
0.40 |
0.40151470588235 |
$2,490,569 |
2490568.8019632 |
|
 Jayson Durocher
 |
Durocher Jayson |
RP |
$320,000 |
320000 |
0.78% |
0.78 |
-0.03 |
-0.0289892 |
— |
0 |
— |
0 |
|
 Matt Kinney
 |
Kinney Matt |
RP |
$318,000 |
318000 |
0.77% |
0.77 |
1.63 |
1.62676 |
5.12 |
5.1155974842767 |
$195,481 |
195480.58717942 |
|
 Brady Clark
 |
Clark Brady |
RF |
$312,500 |
312500 |
0.76% |
0.76 |
0.66 |
0.659413 |
2.11 |
2.1101216 |
$473,906 |
473906.33790963 |
|
 Nick Neugebauer
 |
Neugebauer Nick |
DNP |
$305,000 |
305000 |
0.74% |
0.74 |
— |
0.00 |
— |
0 |
— |
0 |
|
 Keith Ginter
 |
Ginter Keith |
2B |
$301,000 |
301000 |
0.73% |
0.73 |
0.77 |
0.773338 |
2.57 |
2.5692292358804 |
$389,222 |
389221.78917886 |
|
 Alejandro Machado
 |
Machado Alejandro |
DNP |
$300,000 |
300000 |
0.73% |
0.73 |
— |
0.00 |
— |
0 |
— |
0 |
|
 Wes Obermueller
 |
Obermueller Wes |
RP |
$300,000 |
300000 |
0.73% |
0.73 |
-0.85 |
-0.84959 |
— |
0 |
— |
0 |
|
 Shane Nance
 |
Nance Shane |
RP |
$300,000 |
300000 |
0.73% |
0.73 |
0.26 |
0.262996 |
0.88 |
0.87665333333333 |
$1,140,702 |
1140701.7597226 |
|
 Jason Conti
 |
Conti Jason |
RF |
$300,000 |
300000 |
0.73% |
0.73 |
-0.08 |
-0.0752552 |
— |
0 |
— |
0 |
|
 Scott Podsednik
 |
Podsednik Scott |
CF |
$300,000 |
300000 |
0.73% |
0.73 |
3.61 |
3.60694 |
12.02 |
12.023133333333 |
$83,173 |
83172.994283243 |
|
 Matt Ford
 |
Ford Matt |
RP |
$300,000 |
300000 |
0.73% |
0.73 |
-0.85 |
-0.854626 |
— |
0 |
— |
0 |
|
 John Foster
 |
Foster John |
RP |
$300,000 |
300000 |
0.73% |
0.73 |
0.26 |
0.258626 |
0.86 |
0.86208666666667 |
$1,159,976 |
1159976.1818224 |
|
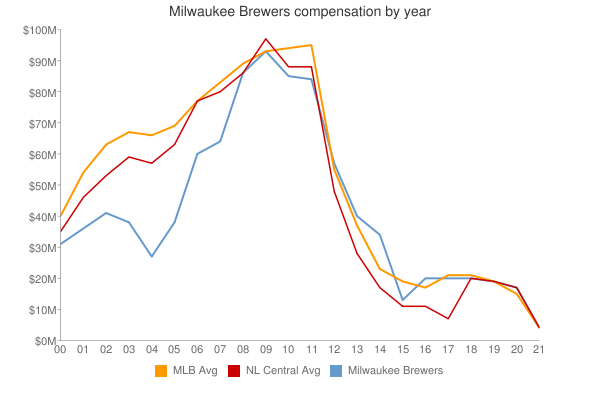
| Year | Brewers payroll |
PR Sort |
Avg payroll |
AvgPR Sort |
Diff |
Diff Sort |
|---|
| 2000 | $35,770,333 | 35770333 | $55,368,142 | 55368142 | $-19,597,809 | -19597809 |
| 2001 | $44,278,333 | 44278333 | $64,937,084 | 64937084 | $-20,658,751 | -20658751 |
| 2002 | $50,062,333 | 50062333 | $67,238,672 | 67238672 | $-17,176,339 | -17176339 |
| 2003 | $41,052,000 | 41052000 | $70,654,480 | 70654480 | $-29,602,480 | -29602480 |
| 2004 | $27,428,500 | 27428500 | $69,466,729 | 69466729 | $-42,038,229 | -42038229 |
| 2005 | $38,488,000 | 38488000 | $74,114,841 | 74114841 | $-35,626,841 | -35626841 |
| 2006 | $60,452,000 | 60452000 | $79,621,815 | 79621815 | $-19,169,815 | -19169815 |
| 2007 | $70,575,500 | 70575500 | $85,537,470 | 85537470 | $-14,961,970 | -14961970 |
| 2008 | $78,594,000 | 78594000 | $92,003,799 | 92003799 | $-13,409,799 | -13409799 |
| 2009 | $80,682,500 | 80682500 | $92,169,598 | 92169598 | $-11,487,098 | -11487098 |
| 2010 | $82,258,000 | 82258000 | $94,342,601 | 94342601 | $-12,084,601 | -12084601 |
| 2011 | $84,253,333 | 84253333 | $96,974,710 | 96974710 | $-12,721,377 | -12721377 |
| 2012 | $97,650,833 | 97650833 | $100,947,217 | 100947217 | $-3,296,384 | -3296384 |
| 2013 | $89,978,333 | 89978333 | $108,586,966 | 108586966 | $-18,608,633 | -18608633 |
| 2014 | $103,697,967 | 103697967 | $117,131,361 | 117131361 | $-13,433,394 | -13433394 |
| 2015 | $104,237,000 | 104237000 | $126,168,161 | 126168161 | $-21,931,161 | -21931161 |
| 2016 | $63,908,300 | 63908300 | $131,756,569 | 131756569 | $-67,848,269 | -67848269 |
| 2017 | $63,061,300 | 63061300 | $136,337,445 | 136337445 | $-73,276,145 | -73276145 |
| 2018 | $90,964,571 | 90964571 | $135,360,600 | 135360600 | $-44,396,029 | -44396029 |
| 2019 | $123,430,400 | 123430400 | $134,792,134 | 134792134 | $-11,361,734 | -11361734 |
| 2020 | $98,563,503 | 98563503 | $139,496,467 | 139496467 | $-40,932,964 | -40932964 |
| 2021 | $96,341,127 | 96341127 | $130,712,288 | 130712288 | $-34,371,161 | -34371161 |
| 2022 | $130,946,826 | 130946826 | $149,802,695 | 149802695 | $-18,855,869 | -18855869 |
| 2023 | $117,578,060 | 117578060 | $161,692,345 | 161692345 | $-44,114,285 | -44114285 |
| 2024 | $78,234,960 | 78234960 | $136,306,249 | 136306249 | $-58,071,289 | -58071289 |
| 2025 | $59,700,000 | 59700000 | $98,329,527 | 98329527 | $-38,629,527 | -38629527 |
| 2026 | $45,700,000 | 45700000 | $78,039,273 | 78039273 | $-32,339,273 | -32339273 |
| 2027 | $33,700,000 | 33700000 | $60,919,343 | 60919343 | $-27,219,343 | -27219343 |
| 2028 | $27,000,000 | 27000000 | $46,901,712 | 46901712 | $-19,901,712 | -19901712 |
| 2029 | $6,500,000 | 6500000 | $38,597,944 | 38597944 | $-32,097,944 | -32097944 |
|
 2003 Milwaukee Brewers