| Player | Player Sort | Pos | Salary | Salary Sort | Pct | Pct Sort | WARP | WARP Sort | WARP/$M | WARP/$M Sort | $/WARP | $/WARP Sort | Current Status |
|---|
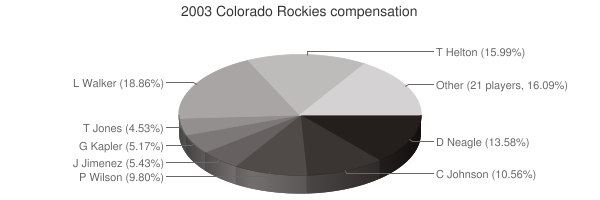
 Larry Walker
 |
Walker Larry |
RF |
$12,500,000 |
12500000 |
18.99% |
18.99 |
3.67 |
3.66523 |
0.29 |
0.2932184 |
$3,410,427 |
3410427.1764664 |
|
 Todd Helton
 |
Helton Todd |
1B |
$10,600,000 |
10600000 |
16.10% |
16.10 |
7.95 |
7.94978 |
0.75 |
0.74997924528302 |
$1,333,370 |
1333370.2316291 |
|
 Denny Neagle
 |
Neagle Denny |
RP |
$9,000,000 |
9000000 |
13.67% |
13.67 |
-0.64 |
-0.637588 |
— |
0 |
— |
0 |
|
 Charles Johnson
 |
Johnson Charles |
C |
$7,000,000 |
7000000 |
10.63% |
10.63 |
-0.14 |
-0.135457 |
— |
0 |
— |
0 |
|
 Preston Wilson
 |
Wilson Preston |
CF |
$6,500,000 |
6500000 |
9.87% |
9.87 |
1.17 |
1.168 |
0.18 |
0.17969230769231 |
$5,565,068 |
5565068.4931507 |
|
 Jose Jimenez
 |
Jimenez Jose |
RP |
$3,600,000 |
3600000 |
5.47% |
5.47 |
-1.05 |
-1.05047 |
— |
0 |
— |
0 |
|
 Gabe Kapler
 |
Kapler Gabe |
PH |
$3,425,000 |
3425000 |
5.20% |
5.20 |
-0.27 |
-0.269906 |
— |
0 |
— |
0 |
|
 Todd Jones
 |
Jones Todd |
RP |
$3,000,000 |
3000000 |
4.56% |
4.56 |
0.10 |
0.0997413 |
0.03 |
0.0332471 |
$30,077,811 |
30077811.297827 |
|
 Jay Payton
 |
Payton Jay |
LF |
$1,850,000 |
1850000 |
2.81% |
2.81 |
3.47 |
3.46827 |
1.87 |
1.8747405405405 |
$533,407 |
533407.14534912 |
|
 Justin Speier
 |
Speier Justin |
RP |
$850,000 |
850000 |
1.29% |
1.29 |
0.39 |
0.394763 |
0.46 |
0.46442705882353 |
$2,153,191 |
2153190.6485664 |
|
 José Hernández
 |
Hernandez Jose |
SS |
$800,000 |
800000 |
1.22% |
1.22 |
-1.08 |
-1.08265 |
— |
0 |
— |
0 |
|
 Steve Reed
 |
Reed Steve |
RP |
$600,000 |
600000 |
0.91% |
0.91 |
0.38 |
0.379141 |
0.63 |
0.63190166666667 |
$1,582,525 |
1582524.707167 |
|
 Greg Norton
 |
Norton Greg |
PH |
$600,000 |
600000 |
0.91% |
0.91 |
0.21 |
0.213049 |
0.36 |
0.35508166666667 |
$2,816,254 |
2816253.5379185 |
|
 Chris Stynes
 |
Stynes Chris |
3B |
$550,000 |
550000 |
0.84% |
0.84 |
0.97 |
0.969441 |
1.76 |
1.76262 |
$567,337 |
567337.25930717 |
|
 Scott Elarton
 |
Elarton Scott |
RP |
$500,000 |
500000 |
0.76% |
0.76 |
-1.42 |
-1.42044 |
— |
0 |
— |
0 |
|
 Bobby Estalella
 |
Estalella Bobby |
C |
$500,000 |
500000 |
0.76% |
0.76 |
0.82 |
0.81751 |
1.64 |
1.63502 |
$611,613 |
611613.31359861 |
|
 Ronnie Belliard
 |
Belliard Ronnie |
2B |
$475,000 |
475000 |
0.72% |
0.72 |
-0.13 |
-0.127255 |
— |
0 |
— |
0 |
|
 Dan Miceli
 |
Miceli Dan |
RP |
$350,000 |
350000 |
0.53% |
0.53 |
0.20 |
0.196564 |
0.56 |
0.56161142857143 |
$1,780,591 |
1780590.5455729 |
|
 Darren Oliver
 |
Oliver Darren |
RP |
$350,000 |
350000 |
0.53% |
0.53 |
-0.33 |
-0.329243 |
— |
0 |
— |
0 |
|
 Chris Richard
 |
Richard Chris |
PH |
$325,000 |
325000 |
0.49% |
0.49 |
-0.11 |
-0.108866 |
— |
0 |
— |
0 |
|
 Jason Jennings
 |
Jennings Jason |
RP |
$325,000 |
325000 |
0.49% |
0.49 |
-0.39 |
-0.389122 |
— |
0 |
— |
0 |
|
 David Coggin
 |
Coggin David |
DNP |
$320,000 |
320000 |
0.49% |
0.49 |
— |
0.00 |
— |
0 |
— |
0 |
|
 Denny Stark
 |
Stark Denny |
RP |
$310,000 |
310000 |
0.47% |
0.47 |
-2.40 |
-2.4049 |
— |
0 |
— |
0 |
|
 Shawn Chacon
 |
Chacon Shawn |
RP |
$300,000 |
300000 |
0.46% |
0.46 |
0.65 |
0.654937 |
2.18 |
2.1831233333333 |
$458,059 |
458059.32479002 |
|
 Aaron Cook
 |
Cook Aaron |
RP |
$300,000 |
300000 |
0.46% |
0.46 |
-2.25 |
-2.24559 |
— |
0 |
— |
0 |
|
 Javier López
 |
Lopez Javier |
RP |
$300,000 |
300000 |
0.46% |
0.46 |
0.51 |
0.512138 |
1.71 |
1.7071266666667 |
$585,780 |
585779.61408839 |
|
 Juan Uribe
 |
Uribe Juan |
SS |
$300,000 |
300000 |
0.46% |
0.46 |
1.61 |
1.6119 |
5.37 |
5.373 |
$186,116 |
186115.76400521 |
|
 Brian Fuentes
 |
Fuentes Brian |
RP |
$300,000 |
300000 |
0.46% |
0.46 |
1.02 |
1.01748 |
3.39 |
3.3916 |
$294,846 |
294846.09034084 |
|
| Year | Rockies payroll |
PR Sort |
Avg payroll |
AvgPR Sort |
Diff |
Diff Sort |
|---|
| 2000 | $61,258,690 | 61258690 | $55,368,142 | 55368142 | $5,890,548 | 5890548 |
| 2001 | $71,198,334 | 71198334 | $64,937,084 | 64937084 | $6,261,250 | 6261250 |
| 2002 | $54,206,543 | 54206543 | $67,238,672 | 67238672 | $-13,032,129 | -13032129 |
| 2003 | $65,830,000 | 65830000 | $70,654,480 | 70654480 | $-4,824,480 | -4824480 |
| 2004 | $63,788,500 | 63788500 | $69,466,729 | 69466729 | $-5,678,229 | -5678229 |
| 2005 | $57,115,500 | 57115500 | $74,114,841 | 74114841 | $-16,999,341 | -16999341 |
| 2006 | $41,666,000 | 41666000 | $79,621,815 | 79621815 | $-37,955,815 | -37955815 |
| 2007 | $57,062,000 | 57062000 | $85,537,470 | 85537470 | $-28,475,470 | -28475470 |
| 2008 | $69,856,500 | 69856500 | $92,003,799 | 92003799 | $-22,147,299 | -22147299 |
| 2009 | $75,605,533 | 75605533 | $92,169,598 | 92169598 | $-16,564,065 | -16564065 |
| 2010 | $84,618,333 | 84618333 | $94,342,601 | 94342601 | $-9,724,268 | -9724268 |
| 2011 | $82,311,404 | 82311404 | $96,974,710 | 96974710 | $-14,663,306 | -14663306 |
| 2012 | $80,164,571 | 80164571 | $100,947,217 | 100947217 | $-20,782,646 | -20782646 |
| 2013 | $74,624,071 | 74624071 | $108,586,966 | 108586966 | $-33,962,895 | -33962895 |
| 2014 | $93,581,071 | 93581071 | $117,131,361 | 117131361 | $-23,550,290 | -23550290 |
| 2015 | $97,069,630 | 97069630 | $126,168,161 | 126168161 | $-29,098,531 | -29098531 |
| 2016 | $112,645,071 | 112645071 | $131,756,569 | 131756569 | $-19,111,498 | -19111498 |
| 2017 | $127,828,571 | 127828571 | $136,337,445 | 136337445 | $-8,508,874 | -8508874 |
| 2018 | $136,953,500 | 136953500 | $135,360,600 | 135360600 | $1,592,900 | 1592900 |
| 2019 | $145,248,500 | 145248500 | $134,792,134 | 134792134 | $10,456,366 | 10456366 |
| 2020 | $154,949,500 | 154949500 | $139,496,467 | 139496467 | $15,453,033 | 15453033 |
| 2021 | $119,764,000 | 119764000 | $130,712,288 | 130712288 | $-10,948,288 | -10948288 |
| 2022 | $150,070,000 | 150070000 | $149,802,695 | 149802695 | $267,305 | 267305 |
| 2023 | $149,598,000 | 149598000 | $161,692,345 | 161692345 | $-12,094,345 | -12094345 |
| 2024 | $125,739,286 | 125739286 | $136,306,249 | 136306249 | $-10,566,963 | -10566963 |
| 2025 | $89,714,286 | 89714286 | $98,329,527 | 98329527 | $-8,615,241 | -8615241 |
| 2026 | $81,964,286 | 81964286 | $78,039,273 | 78039273 | $3,925,013 | 3925013 |
| 2027 | $51,214,286 | 51214286 | $60,919,343 | 60919343 | $-9,705,057 | -9705057 |
| 2028 | $38,214,286 | 38214286 | $46,901,712 | 46901712 | $-8,687,426 | -8687426 |
| 2029 | $14,214,286 | 14214286 | $38,597,944 | 38597944 | $-24,383,658 | -24383658 |
| 2030 | $16,214,286 | 16214286 | $41,447,579 | 41447579 | $-25,233,293 | -25233293 |
| 2031 | $2,500,000 | 2500000 | $38,360,152 | 38360152 | $-35,860,152 | -35860152 |
|
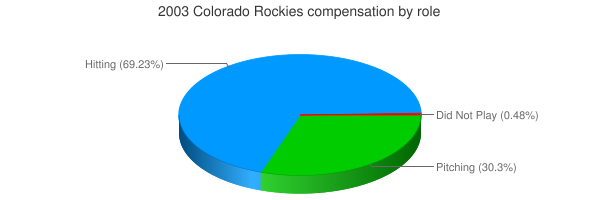
 2003 Colorado Rockies