| Player | Player Sort | Pos | Salary | Salary Sort | Pct | Pct Sort | WARP | WARP Sort | WARP/$M | WARP/$M Sort | $/WARP | $/WARP Sort | Current Status |
|---|
 Sammy Sosa
 |
Sosa Sammy |
RF |
$16,000,000 |
16000000 |
17.93% |
17.93 |
2.56 |
2.56215 |
0.16 |
0.160134375 |
$6,244,755 |
6244755.3812228 |
|
 Moises Alou
 |
Alou Moises |
LF |
$9,500,000 |
9500000 |
10.65% |
10.65 |
5.00 |
4.99705 |
0.53 |
0.52600526315789 |
$1,901,122 |
1901121.6617805 |
|
 Kerry Wood
 |
Wood Kerry |
RP |
$8,000,000 |
8000000 |
8.97% |
8.97 |
4.10 |
4.09854 |
0.51 |
0.5123175 |
$1,951,915 |
1951914.5842178 |
|
 Derrek Lee
 |
Lee Derrek |
1B |
$6,166,667 |
6166667 |
6.91% |
6.91 |
3.05 |
3.05208 |
0.49 |
0.49493186513882 |
$2,020,480 |
2020480.1315824 |
|
 Aramis Ramirez
 |
Ramirez Aramis |
3B |
$6,000,000 |
6000000 |
6.72% |
6.72 |
4.17 |
4.17218 |
0.70 |
0.69536333333333 |
$1,438,097 |
1438097.1099042 |
|
 Matt Clement
 |
Clement Matt |
RP |
$6,000,000 |
6000000 |
6.72% |
6.72 |
5.32 |
5.31877 |
0.89 |
0.88646166666667 |
$1,128,080 |
1128080.3644452 |
|
 Greg Maddux
 |
Maddux Greg |
RP |
$6,000,000 |
6000000 |
6.72% |
6.72 |
6.63 |
6.63103 |
1.11 |
1.1051716666667 |
$904,837 |
904836.80514189 |
|
 Alex Gonzalez
 |
Gonzalez Alex |
SS |
$5,750,000 |
5750000 |
6.44% |
6.44 |
-0.39 |
-0.391714 |
— |
0 |
— |
0 |
|
 Mike Remlinger
 |
Remlinger Mike |
RP |
$3,550,000 |
3550000 |
3.98% |
3.98 |
0.43 |
0.42841 |
0.12 |
0.12067887323944 |
$8,286,455 |
8286454.5645526 |
|
 LaTroy Hawkins
 |
Hawkins LaTroy |
RP |
$3,000,000 |
3000000 |
3.36% |
3.36 |
1.58 |
1.57614 |
0.53 |
0.52538 |
$1,903,384 |
1903384.2171381 |
|
 Mark Grudzielanek
 |
Grudzielanek Mark |
2B |
$2,500,000 |
2500000 |
2.80% |
2.80 |
1.13 |
1.12887 |
0.45 |
0.451548 |
$2,214,604 |
2214603.9845155 |
FA/2011 |
 Joe Borowski
 |
Borowski Joe |
RP |
$2,000,000 |
2000000 |
2.24% |
2.24 |
-0.22 |
-0.222274 |
— |
0 |
— |
0 |
|
 Todd Walker
 |
Walker Todd |
2B |
$1,750,000 |
1750000 |
1.96% |
1.96 |
2.47 |
2.46882 |
1.41 |
1.4107542857143 |
$708,841 |
708840.66072051 |
|
 Mark Prior
 |
Prior Mark |
RP |
$1,600,000 |
1600000 |
1.79% |
1.79 |
3.98 |
3.983 |
2.49 |
2.489375 |
$401,707 |
401707.25583731 |
|
 Michael Barrett
 |
Barrett Michael |
C |
$1,550,000 |
1550000 |
1.74% |
1.74 |
3.60 |
3.59611 |
2.32 |
2.3200709677419 |
$431,021 |
431021.29801369 |
|
 Kyle Farnsworth
 |
Farnsworth Kyle |
RP |
$1,400,000 |
1400000 |
1.57% |
1.57 |
1.59 |
1.58687 |
1.13 |
1.1334785714286 |
$882,240 |
882239.88102365 |
|
 Kent Mercker
 |
Mercker Kent |
RP |
$1,200,000 |
1200000 |
1.34% |
1.34 |
0.83 |
0.830629 |
0.69 |
0.69219083333333 |
$1,444,688 |
1444688.3024792 |
|
 Todd Hollandsworth
 |
Hollandsworth Todd |
RF |
$1,000,000 |
1000000 |
1.12% |
1.12 |
1.18 |
1.17655 |
1.18 |
1.17655 |
$849,943 |
849942.62887255 |
|
 Ramon Martinez
 |
Martinez Ramon |
SS |
$900,000 |
900000 |
1.01% |
1.01 |
0.76 |
0.757552 |
0.84 |
0.84172444444444 |
$1,188,037 |
1188037.2568484 |
|
 Paul Bako
 |
Bako Paul |
C |
$865,000 |
865000 |
0.97% |
0.97 |
0.35 |
0.3497 |
0.40 |
0.4042774566474 |
$2,473,549 |
2473548.7560766 |
|
 Jose Macias
 |
Macias Jose |
PH |
$750,000 |
750000 |
0.84% |
0.84 |
-0.26 |
-0.256301 |
— |
0 |
— |
0 |
|
 Tom Goodwin
 |
Goodwin Tom |
PH |
$650,000 |
650000 |
0.73% |
0.73 |
-0.49 |
-0.490737 |
— |
0 |
— |
0 |
|
 Rey Ordonez
 |
Ordonez Rey |
SS |
$650,000 |
650000 |
0.73% |
0.73 |
-0.71 |
-0.70672 |
— |
0 |
— |
0 |
|
 Corey Patterson
 |
Patterson Corey |
CF |
$480,000 |
480000 |
0.54% |
0.54 |
2.45 |
2.44508 |
5.09 |
5.0939166666667 |
$196,313 |
196312.59508891 |
|
 Carlos Zambrano
 |
Zambrano Carlos |
RP |
$450,000 |
450000 |
0.50% |
0.50 |
6.41 |
6.40717 |
14.24 |
14.238155555556 |
$70,234 |
70233.816177813 |
|
 Todd Wellemeyer
 |
Wellemeyer Todd |
RP |
$310,000 |
310000 |
0.35% |
0.35 |
0.24 |
0.243484 |
0.79 |
0.78543225806452 |
$1,273,184 |
1273184.2749421 |
|
 Sergio Mitre
 |
Mitre Sergio |
RP |
$305,000 |
305000 |
0.34% |
0.34 |
1.07 |
1.06771 |
3.50 |
3.5006885245902 |
$285,658 |
285658.09068005 |
|
 Ryan Dempster
 |
Dempster Ryan |
RP |
$300,000 |
300000 |
0.34% |
0.34 |
0.15 |
0.148293 |
0.49 |
0.49431 |
$2,023,022 |
2023021.990249 |
|
 Michael Wuertz
 |
Wuertz Michael |
RP |
$300,000 |
300000 |
0.34% |
0.34 |
0.52 |
0.519366 |
1.73 |
1.73122 |
$577,627 |
577627.33794665 |
|
 Andy Pratt
 |
Pratt Andy |
RP |
$300,000 |
300000 |
0.34% |
0.34 |
-0.10 |
-0.0967353 |
— |
0 |
— |
0 |
|
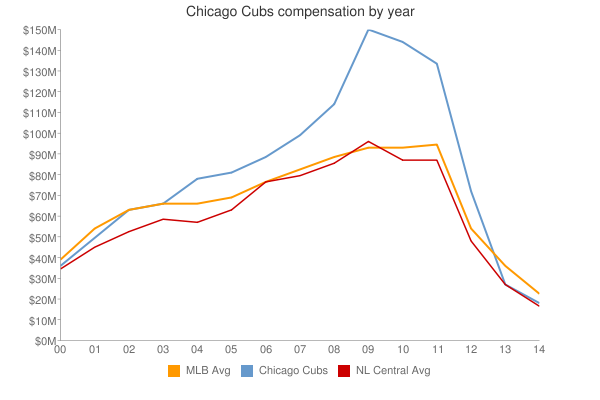
| Year | Cubs payroll |
PR Sort |
Avg payroll |
AvgPR Sort |
Diff |
Diff Sort |
|---|
| 2000 | $61,584,333 | 61584333 | $55,368,142 | 55368142 | $6,216,191 | 6216191 |
| 2001 | $64,315,833 | 64315833 | $64,937,084 | 64937084 | $-621,251 | -621251 |
| 2002 | $74,959,833 | 74959833 | $67,238,672 | 67238672 | $7,721,161 | 7721161 |
| 2003 | $79,805,000 | 79805000 | $70,654,480 | 70654480 | $9,150,520 | 9150520 |
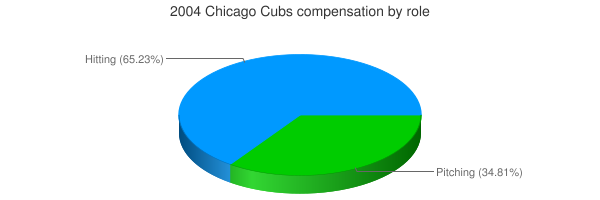
| 2004 | $89,226,667 | 89226667 | $69,466,729 | 69466729 | $19,759,938 | 19759938 |
| 2005 | $85,064,767 | 85064767 | $74,114,841 | 74114841 | $10,949,926 | 10949926 |
| 2006 | $93,257,833 | 93257833 | $79,621,815 | 79621815 | $13,636,018 | 13636018 |
| 2007 | $99,285,666 | 99285666 | $85,537,470 | 85537470 | $13,748,196 | 13748196 |
| 2008 | $120,270,833 | 120270833 | $92,003,799 | 92003799 | $28,267,034 | 28267034 |
| 2009 | $135,142,333 | 135142333 | $92,169,598 | 92169598 | $42,972,735 | 42972735 |
| 2010 | $143,359,000 | 143359000 | $94,342,601 | 94342601 | $49,016,399 | 49016399 |
| 2011 | $134,329,000 | 134329000 | $96,974,710 | 96974710 | $37,354,290 | 37354290 |
| 2012 | $111,034,202 | 111034202 | $100,947,217 | 100947217 | $10,086,985 | 10086985 |
| 2013 | $107,375,524 | 107375524 | $108,586,966 | 108586966 | $-1,211,442 | -1211442 |
| 2014 | $92,677,368 | 92677368 | $117,131,361 | 117131361 | $-24,453,993 | -24453993 |
| 2015 | $120,337,385 | 120337385 | $126,168,161 | 126168161 | $-5,830,776 | -5830776 |
| 2016 | $171,611,832 | 171611832 | $131,756,569 | 131756569 | $39,855,263 | 39855263 |
| 2017 | $172,199,881 | 172199881 | $136,337,445 | 136337445 | $35,862,436 | 35862436 |
| 2018 | $183,156,139 | 183156139 | $135,360,600 | 135360600 | $47,795,539 | 47795539 |
| 2019 | $214,246,988 | 214246988 | $134,792,134 | 134792134 | $79,454,854 | 79454854 |
| 2020 | $188,459,500 | 188459500 | $139,496,467 | 139496467 | $48,963,033 | 48963033 |
| 2021 | $152,542,000 | 152542000 | $130,712,288 | 130712288 | $21,829,712 | 21829712 |
| 2022 | $140,736,000 | 140736000 | $149,802,695 | 149802695 | $-9,066,695 | -9066695 |
| 2023 | $185,159,250 | 185159250 | $161,692,345 | 161692345 | $23,466,905 | 23466905 |
| 2024 | $192,295,000 | 192295000 | $136,306,249 | 136306249 | $55,988,751 | 55988751 |
| 2025 | $141,750,000 | 141750000 | $98,329,527 | 98329527 | $43,420,473 | 43420473 |
| 2026 | $136,250,000 | 136250000 | $78,039,273 | 78039273 | $58,210,727 | 58210727 |
| 2027 | $43,250,000 | 43250000 | $60,919,343 | 60919343 | $-17,669,343 | -17669343 |
| 2028 | $27,000,000 | 27000000 | $46,901,712 | 46901712 | $-19,901,712 | -19901712 |
| 2029 | $26,000,000 | 26000000 | $38,597,944 | 38597944 | $-12,597,944 | -12597944 |
|
 2004 Chicago Cubs