| Player | Player Sort | Pos | Salary | Salary Sort | Pct | Pct Sort | WARP | WARP Sort | WARP/$M | WARP/$M Sort | $/WARP | $/WARP Sort | Current Status |
|---|
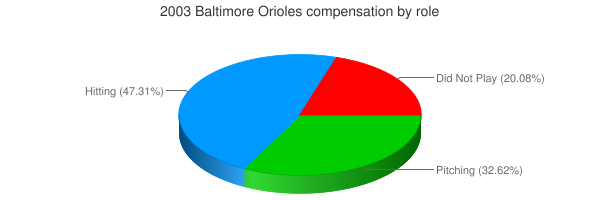
 Albert Belle
 |
Belle Albert |
DNP |
$13,000,000 |
13000000 |
17.74% |
17.74 |
— |
0.00 |
— |
0 |
— |
0 |
|
 Scott Erickson
 |
Erickson Scott |
DNP |
$7,030,000 |
7030000 |
9.59% |
9.59 |
— |
0.00 |
— |
0 |
— |
0 |
|
 David Segui
 |
Segui David |
DH |
$7,000,000 |
7000000 |
9.55% |
9.55 |
0.04 |
0.0419814 |
0.01 |
0.0059973428571429 |
$166,740,509 |
166740508.89203 |
|
 Tony Batista
 |
Batista Tony |
3B |
$6,000,000 |
6000000 |
8.19% |
8.19 |
-0.14 |
-0.140608 |
— |
0 |
— |
0 |
|
 Jeff Conine
 |
Conine Jeff |
1B |
$4,500,000 |
4500000 |
6.14% |
6.14 |
2.21 |
2.21252 |
0.49 |
0.49167111111111 |
$2,033,880 |
2033879.9197295 |
|
 Sidney Ponson
 |
Ponson Sidney |
RP |
$4,250,000 |
4250000 |
5.80% |
5.80 |
2.61 |
2.605 |
0.61 |
0.61294117647059 |
$1,631,478 |
1631477.9270633 |
|
 Willis Roberts
 |
Roberts Willis |
RP |
$3,500,000 |
3500000 |
4.78% |
4.78 |
-0.02 |
-0.0207827 |
— |
0 |
— |
0 |
|
 Brook Fordyce
 |
Fordyce Brook |
C |
$3,250,000 |
3250000 |
4.43% |
4.43 |
2.50 |
2.49775 |
0.77 |
0.76853846153846 |
$1,301,171 |
1301171.0539486 |
|
 Marty Cordova
 |
Cordova Marty |
DH |
$3,100,000 |
3100000 |
4.23% |
4.23 |
0.31 |
0.31285 |
0.10 |
0.10091935483871 |
$9,908,902 |
9908902.0297267 |
|
 Omar Daal
 |
Daal Omar |
RP |
$3,000,000 |
3000000 |
4.09% |
4.09 |
-0.61 |
-0.607606 |
— |
0 |
— |
0 |
|
 Buddy Groom
 |
Groom Buddy |
RP |
$3,000,000 |
3000000 |
4.09% |
4.09 |
0.39 |
0.391916 |
0.13 |
0.13063866666667 |
$7,654,702 |
7654701.5176722 |
|
 Jason Johnson
 |
Johnson Jason |
RP |
$2,900,000 |
2900000 |
3.96% |
3.96 |
0.11 |
0.112309 |
0.04 |
0.03872724137931 |
$25,821,617 |
25821617.145554 |
|
 Melvin Mora
 |
Mora Melvin |
LF |
$1,725,000 |
1725000 |
2.35% |
2.35 |
4.62 |
4.61629 |
2.68 |
2.6761101449275 |
$373,677 |
373676.69708792 |
|
 Jerry Hairston
 |
Hairston Jerry |
2B |
$1,550,000 |
1550000 |
2.12% |
2.12 |
0.07 |
0.0690383 |
0.04 |
0.044540838709677 |
$22,451,306 |
22451306.014198 |
|
 Pat Hentgen
 |
Hentgen Pat |
RP |
$1,200,000 |
1200000 |
1.64% |
1.64 |
0.09 |
0.0864586 |
0.07 |
0.072048833333333 |
$13,879,475 |
13879475.263305 |
|
 B.J. Surhoff
 |
Surhoff B.J. |
DH |
$1,000,000 |
1000000 |
1.36% |
1.36 |
0.41 |
0.406377 |
0.41 |
0.406377 |
$2,460,769 |
2460769.1872325 |
|
 Rick Helling
 |
Helling Rick |
RP |
$1,000,000 |
1000000 |
1.36% |
1.36 |
-1.37 |
-1.37311 |
— |
0 |
— |
0 |
|
 Deivi Cruz
 |
Cruz Deivi |
SS |
$1,000,000 |
1000000 |
1.36% |
1.36 |
-0.27 |
-0.265998 |
— |
0 |
— |
0 |
|
 Kerry Ligtenberg
 |
Ligtenberg Kerry |
RP |
$1,000,000 |
1000000 |
1.36% |
1.36 |
0.50 |
0.501426 |
0.50 |
0.501426 |
$1,994,312 |
1994312.2215442 |
|
 Gary Matthews
 |
Matthews Gary |
CF |
$900,000 |
900000 |
1.23% |
1.23 |
-0.90 |
-0.902592 |
— |
0 |
— |
0 |
|
 B.J. Ryan
 |
Ryan B.J. |
RP |
$762,500 |
762500 |
1.04% |
1.04 |
1.54 |
1.543 |
2.02 |
2.023606557377 |
$494,167 |
494167.20674012 |
|
 Jay Gibbons
 |
Gibbons Jay |
RF |
$375,000 |
375000 |
0.51% |
0.51 |
0.89 |
0.89063 |
2.38 |
2.3750133333333 |
$421,050 |
421050.26778797 |
|
 Jorge Julio
 |
Julio Jorge |
RP |
$350,000 |
350000 |
0.48% |
0.48 |
0.17 |
0.165567 |
0.47 |
0.47304857142857 |
$2,113,948 |
2113947.8277676 |
|
 Geronimo Gil
 |
Gil Geronimo |
C |
$330,000 |
330000 |
0.45% |
0.45 |
0.29 |
0.285885 |
0.87 |
0.86631818181818 |
$1,154,310 |
1154310.299596 |
|
 Rick Bauer
 |
Bauer Rick |
RP |
$325,000 |
325000 |
0.44% |
0.44 |
0.51 |
0.514356 |
1.58 |
1.5826338461538 |
$631,858 |
631858.09050541 |
|
 Rodrigo Lopez
 |
Lopez Rodrigo |
RP |
$325,000 |
325000 |
0.44% |
0.44 |
-0.31 |
-0.310386 |
— |
0 |
— |
0 |
|
 Jose Leon
 |
Leon Jose |
3B |
$305,000 |
305000 |
0.42% |
0.42 |
-0.21 |
-0.214392 |
— |
0 |
— |
0 |
|
 Will Ohman
 |
Ohman Will |
DNP |
$305,000 |
305000 |
0.42% |
0.42 |
— |
0.00 |
— |
0 |
— |
0 |
|
 Jose Morban
 |
Morban Jose |
PR |
$300,000 |
300000 |
0.41% |
0.41 |
-0.66 |
-0.661692 |
— |
0 |
— |
0 |
|
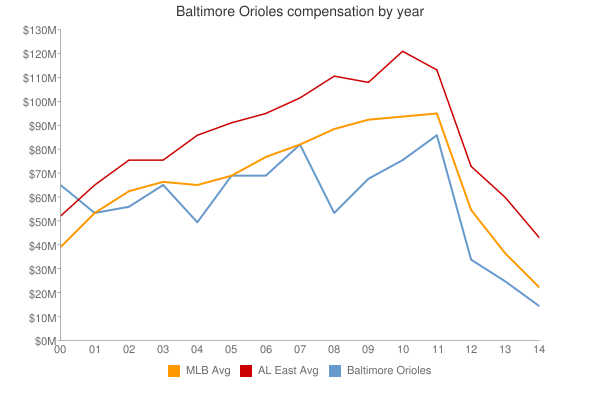
| Year | Orioles payroll |
PR Sort |
Avg payroll |
AvgPR Sort |
Diff |
Diff Sort |
|---|
| 2000 | $82,250,111 | 82250111 | $55,368,142 | 55368142 | $26,881,969 | 26881969 |
| 2001 | $73,894,540 | 73894540 | $64,937,084 | 64937084 | $8,957,456 | 8957456 |
| 2002 | $60,496,987 | 60496987 | $67,238,672 | 67238672 | $-6,741,685 | -6741685 |
| 2003 | $73,282,500 | 73282500 | $70,654,480 | 70654480 | $2,628,020 | 2628020 |
| 2004 | $53,273,333 | 53273333 | $69,466,729 | 69466729 | $-16,193,396 | -16193396 |
| 2005 | $73,066,833 | 73066833 | $74,114,841 | 74114841 | $-1,048,008 | -1048008 |
| 2006 | $83,729,266 | 83729266 | $79,621,815 | 79621815 | $4,107,451 | 4107451 |
| 2007 | $94,056,726 | 94056726 | $85,537,470 | 85537470 | $8,519,256 | 8519256 |
| 2008 | $66,644,581 | 66644581 | $92,003,799 | 92003799 | $-25,359,218 | -25359218 |
| 2009 | $68,369,792 | 68369792 | $92,169,598 | 92169598 | $-23,799,806 | -23799806 |
| 2010 | $75,412,500 | 75412500 | $94,342,601 | 94342601 | $-18,930,101 | -18930101 |
| 2011 | $88,184,250 | 88184250 | $96,974,710 | 96974710 | $-8,790,460 | -8790460 |
| 2012 | $84,769,000 | 84769000 | $100,947,217 | 100947217 | $-16,178,217 | -16178217 |
| 2013 | $92,238,334 | 92238334 | $108,586,966 | 108586966 | $-16,348,632 | -16348632 |
| 2014 | $107,976,154 | 107976154 | $117,131,361 | 117131361 | $-9,155,207 | -9155207 |
| 2015 | $118,975,833 | 118975833 | $126,168,161 | 126168161 | $-7,192,328 | -7192328 |
| 2016 | $147,693,714 | 147693714 | $131,756,569 | 131756569 | $15,937,145 | 15937145 |
| 2017 | $164,326,172 | 164326172 | $136,337,445 | 136337445 | $27,988,727 | 27988727 |
| 2018 | $148,574,615 | 148574615 | $135,360,600 | 135360600 | $13,214,015 | 13214015 |
| 2019 | $80,814,882 | 80814882 | $134,792,134 | 134792134 | $-53,977,252 | -53977252 |
| 2020 | $62,285,088 | 62285088 | $139,496,467 | 139496467 | $-77,211,379 | -77211379 |
| 2021 | $62,525,283 | 62525283 | $130,712,288 | 130712288 | $-68,187,005 | -68187005 |
| 2022 | $43,068,167 | 43068167 | $149,802,695 | 149802695 | $-106,734,528 | -106734528 |
| 2023 | $66,889,067 | 66889067 | $161,692,345 | 161692345 | $-94,803,278 | -94803278 |
| 2024 | $52,645,666 | 52645666 | $136,306,249 | 136306249 | $-83,660,583 | -83660583 |
| 2025 | $2,000,000 | 2000000 | $98,329,527 | 98329527 | $-96,329,527 | -96329527 |
|
 2003 Baltimore Orioles