| Player | Player Sort | Pos | Salary | Salary Sort | Pct | Pct Sort | WARP | WARP Sort | WARP/$M | WARP/$M Sort | $/WARP | $/WARP Sort | Current Status |
|---|
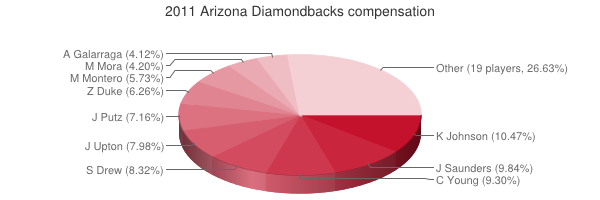
 Kelly Johnson
 |
Johnson Kelly |
2B |
$5,850,000 |
5850000 |
10.47% |
10.47 |
-0.79 |
-0.786404 |
— |
0 |
— |
0 |
|
 Joe Saunders
 |
Saunders Joe |
RP |
$5,500,000 |
5500000 |
9.84% |
9.84 |
0.72 |
0.722147 |
0.13 |
0.13129945454545 |
$7,616,178 |
7616177.8696027 |
|
 Chris Young
 |
Young Chris |
CF |
$5,200,000 |
5200000 |
9.30% |
9.30 |
2.90 |
2.89925 |
0.56 |
0.55754807692308 |
$1,793,567 |
1793567.3018884 |
|
 Stephen Drew
 |
Drew Stephen |
SS |
$4,650,000 |
4650000 |
8.32% |
8.32 |
1.43 |
1.43322 |
0.31 |
0.30821935483871 |
$3,244,443 |
3244442.5838322 |
|
 Justin Upton
 |
Upton Justin |
RF |
$4,458,333 |
4458333 |
7.98% |
7.98 |
5.58 |
5.58108 |
1.25 |
1.2518311216322 |
$798,830 |
798829.7963835 |
|
 J.J. Putz
 |
Putz J.J. |
RP |
$4,000,000 |
4000000 |
7.16% |
7.16 |
1.25 |
1.25202 |
0.31 |
0.313005 |
$3,194,837 |
3194837.1431766 |
|
 Zach Duke
 |
Duke Zach |
RP |
$3,500,000 |
3500000 |
6.26% |
6.26 |
0.07 |
0.0695933 |
0.02 |
0.0198838 |
$50,292,198 |
50292197.668454 |
|
 Miguel Montero
 |
Montero Miguel |
C |
$3,200,000 |
3200000 |
5.73% |
5.73 |
5.25 |
5.2539 |
1.64 |
1.64184375 |
$609,071 |
609071.35651611 |
|
 Melvin Mora
 |
Mora Melvin |
3B |
$2,350,000 |
2350000 |
4.20% |
4.20 |
-0.49 |
-0.4906 |
— |
0 |
— |
0 |
|
 Armando Galarraga
 |
Galarraga Armando |
RP |
$2,300,000 |
2300000 |
4.12% |
4.12 |
-0.44 |
-0.43605 |
— |
0 |
— |
0 |
|
 Aaron Heilman
 |
Heilman Aaron |
RP |
$2,000,000 |
2000000 |
3.58% |
3.58 |
0.13 |
0.128672 |
0.06 |
0.064336 |
$15,543,397 |
15543397.164884 |
|
 Xavier Nady
 |
Nady Xavier |
1B |
$1,750,000 |
1750000 |
3.13% |
3.13 |
-0.28 |
-0.278301 |
— |
0 |
— |
0 |
|
 Chris Snyder
 |
Snyder Chris |
DNP |
$1,500,000 |
1500000 |
2.68% |
2.68 |
— |
0.00 |
— |
0 |
— |
0 |
|
 Geoff Blum
 |
Blum Geoff |
3B |
$1,350,000 |
1350000 |
2.42% |
2.42 |
-0.01 |
-0.00984577 |
— |
0 |
— |
0 |
|
 Henry Blanco
 |
Blanco Henry |
C |
$1,000,000 |
1000000 |
1.79% |
1.79 |
0.74 |
0.738319 |
0.74 |
0.738319 |
$1,354,428 |
1354428.0995071 |
|
 Russell Branyan
 |
Branyan Russell |
PH |
$1,000,000 |
1000000 |
1.79% |
1.79 |
-0.18 |
-0.181581 |
— |
0 |
— |
0 |
|
 Trevor Bauer
 |
Bauer Trevor |
DNP |
$900,000 |
900000 |
1.61% |
1.61 |
— |
0.00 |
— |
0 |
— |
0 |
|
 Willie Bloomquist
 |
Bloomquist Willie |
SS |
$750,000 |
750000 |
1.34% |
1.34 |
-0.00 |
-0.000734465 |
— |
0 |
— |
0 |
|
 Juan Gutierrez
 |
Gutierrez Juan |
RP |
$430,500 |
430500 |
0.77% |
0.77 |
0.38 |
0.384769 |
0.89 |
0.89377235772358 |
$1,118,853 |
1118853.1300599 |
|
 Gerardo Parra
 |
Parra Gerardo |
LF |
$426,000 |
426000 |
0.76% |
0.76 |
4.35 |
4.35045 |
10.21 |
10.212323943662 |
$97,921 |
97920.904733993 |
|
 David Hernandez
 |
Hernandez David |
RP |
$423,500 |
423500 |
0.76% |
0.76 |
1.53 |
1.53304 |
3.62 |
3.6199291617473 |
$276,248 |
276248.49971299 |
|
 Ryan Roberts
 |
Roberts Ryan |
3B |
$423,500 |
423500 |
0.76% |
0.76 |
3.46 |
3.46433 |
8.18 |
8.1802361275089 |
$122,246 |
122245.85994983 |
|
 Ian Kennedy
 |
Kennedy Ian |
RP |
$423,000 |
423000 |
0.76% |
0.76 |
6.20 |
6.19936 |
14.66 |
14.655697399527 |
$68,233 |
68232.849842564 |
|
 Juan Miranda
 |
Miranda Juan |
1B |
$420,000 |
420000 |
0.75% |
0.75 |
-0.07 |
-0.0744282 |
— |
0 |
— |
0 |
|
 Daniel Hudson
 |
Hudson Daniel |
RP |
$419,000 |
419000 |
0.75% |
0.75 |
5.54 |
5.53817 |
13.22 |
13.217589498807 |
$75,657 |
75656.760265575 |
|
 Barry Enright
 |
Enright Barry |
RP |
$418,000 |
418000 |
0.75% |
0.75 |
-0.68 |
-0.679898 |
— |
0 |
— |
0 |
|
 Sam Demel
 |
Demel Sam |
RP |
$417,000 |
417000 |
0.75% |
0.75 |
-0.29 |
-0.289885 |
— |
0 |
— |
0 |
|
 Kam Mickolio
 |
Mickolio Kam |
RP |
$417,000 |
417000 |
0.75% |
0.75 |
-0.12 |
-0.115938 |
— |
0 |
— |
0 |
|
 Joe Paterson
 |
Paterson Joe |
RP |
$414,000 |
414000 |
0.74% |
0.74 |
0.53 |
0.525516 |
1.27 |
1.2693623188406 |
$787,797 |
787797.13652867 |
|
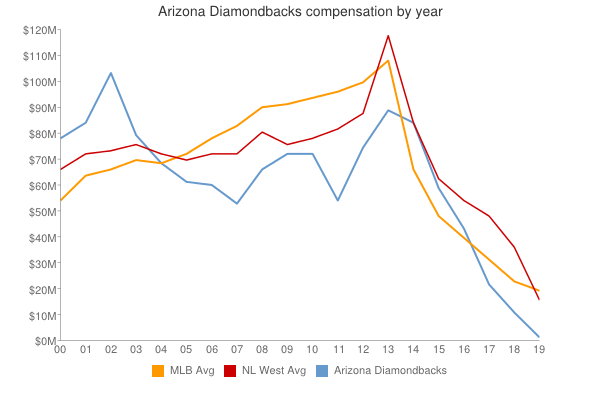
| Year | Diamondbacks payroll |
PR Sort |
Avg payroll |
AvgPR Sort |
Diff |
Diff Sort |
|---|
| 1999 | $8,600,000 | 8600000 | $7,867,823 | 7867823 | $732,177 | 732177 |
| 2000 | $78,869,333 | 78869333 | $56,164,089 | 56164089 | $22,705,244 | 22705244 |
| 2001 | $85,080,499 | 85080499 | $65,991,638 | 65991638 | $19,088,861 | 19088861 |
| 2002 | $104,517,499 | 104517499 | $68,244,471 | 68244471 | $36,273,028 | 36273028 |
| 2003 | $80,557,000 | 80557000 | $71,318,479 | 71318479 | $9,238,521 | 9238521 |
| 2004 | $69,935,750 | 69935750 | $70,466,961 | 70466961 | $-531,211 | -531211 |
| 2005 | $62,413,833 | 62413833 | $73,264,780 | 73264780 | $-10,850,947 | -10850947 |
| 2006 | $62,073,898 | 62073898 | $79,051,754 | 79051754 | $-16,977,856 | -16977856 |
| 2007 | $52,402,000 | 52402000 | $83,931,138 | 83931138 | $-31,529,138 | -31529138 |
| 2008 | $66,138,000 | 66138000 | $90,812,373 | 90812373 | $-24,674,373 | -24674373 |
| 2009 | $73,375,000 | 73375000 | $91,093,211 | 91093211 | $-17,718,211 | -17718211 |
| 2010 | $71,984,833 | 71984833 | $93,373,681 | 93373681 | $-21,388,848 | -21388848 |
| 2011 | $55,889,833 | 55889833 | $96,102,034 | 96102034 | $-40,212,201 | -40212201 |
| 2012 | $75,908,166 | 75908166 | $100,657,138 | 100657138 | $-24,748,972 | -24748972 |
| 2013 | $90,300,500 | 90300500 | $109,024,990 | 109024990 | $-18,724,490 | -18724490 |
| 2014 | $112,315,500 | 112315500 | $117,828,782 | 117828782 | $-5,513,282 | -5513282 |
| 2015 | $88,187,000 | 88187000 | $127,404,244 | 127404244 | $-39,217,244 | -39217244 |
| 2016 | $98,172,683 | 98172683 | $132,219,407 | 132219407 | $-34,046,724 | -34046724 |
| 2017 | $93,120,200 | 93120200 | $137,302,894 | 137302894 | $-44,182,694 | -44182694 |
| 2018 | $131,965,116 | 131965116 | $136,929,168 | 136929168 | $-4,964,052 | -4964052 |
| 2019 | $123,815,766 | 123815766 | $136,944,257 | 136944257 | $-13,128,491 | -13128491 |
| 2020 | $121,918,000 | 121918000 | $140,677,788 | 140677788 | $-18,759,788 | -18759788 |
| 2021 | $96,423,700 | 96423700 | $132,162,631 | 132162631 | $-35,738,931 | -35738931 |
| 2022 | $89,856,200 | 89856200 | $149,374,046 | 149374046 | $-59,517,846 | -59517846 |
| 2023 | $113,296,972 | 113296972 | $160,460,390 | 160460390 | $-47,163,418 | -47163418 |
| 2024 | $122,750,715 | 122750715 | $135,504,022 | 135504022 | $-12,753,307 | -12753307 |
| 2025 | $63,475,000 | 63475000 | $96,417,302 | 96417302 | $-32,942,302 | -32942302 |
| 2026 | $61,225,000 | 61225000 | $76,694,120 | 76694120 | $-15,469,120 | -15469120 |
| 2027 | $51,225,000 | 51225000 | $58,935,617 | 58935617 | $-7,710,617 | -7710617 |
| 2028 | $23,625,000 | 23625000 | $45,437,759 | 45437759 | $-21,812,759 | -21812759 |
| 2029 | $28,625,000 | 28625000 | $37,269,628 | 37269628 | $-8,644,628 | -8644628 |
| 2030 | $28,625,000 | 28625000 | $39,665,769 | 39665769 | $-11,040,769 | -11040769 |
| 2031 | $5,000,000 | 5000000 | $38,360,152 | 38360152 | $-33,360,152 | -33360152 |
|
 2011 Arizona Diamondbacks