This article was originally published on April 28.
Jay Bruce wasn’t a first baseman—not really—but one of the indignities of aging is having to learn new tricks just to cling to your old job. As an outfielder, he was a first-round pick out of high school in 2005, Baseball Prospectus’ number one overall prospect prior to 2008, and an All-Star in 2011, 2012, and 2016. He surpassed 300 home runs and $100 million in career earnings. Yet in his 14th major league season, he attempted a new full-time position simply to cling to employment. The adventure didn’t last long; he retired on April 18.
With Luke Voit and Miguel Andújar injured, Bruce became the Yankees’ best available “first baseman” to start the 2021 season. That’s where he was in the top of the tenth inning on April 7 against the Orioles, just a few days after his 34th birthday. With Anthony Santander serving as the obligatory ghost runner on second to start the inning, the first three batters hit ground balls that induced throws which would put his receiving acumen to the test.
Ryan Mountcastle led off with a hard smash near third. Gio Urshela’s long throw was a little offline, but Bruce made a nice stretch to snare the first out.
Next, Maikel Franco hit a comebacker to pitcher Chad Green, who fired low to first. The ball caught Bruce more than Bruce caught the ball, foreshadowing disaster. Nevertheless, this was out number two, with Santander advancing to third base on the play.
Pedro Severino followed with a routine grounder to shortstop that should have been the final out of the inning, but Gleyber Torres bounced the throw and Bruce failed to corral it. The lead run scored on the error.
The Yankees would tie the score in the bottom of the inning, but Baltimore plated another run in the 11th and won the game, 4-3. The pivotal play was Torres’ E6, and he bore the ire of fans and media for his poor defense. However, Bruce didn’t exactly evoke Don Mattingly. In just his 60th MLB game at first base following 1,510 in the outfield, the bounce pass from shortstop completely flummoxed him. For that matter, so did Green’s on the previous play.
Inarguably, Bruce deserves some portion of the blame for the critical error, but there is no statistical record of his role in the play. Neither traditional nor advanced metrics capture throws that a first baseman fails to catch. We’re all missing something observable and measurable that has affected nearly every baseball game in history!
To shed light on this collective oversight, I did the one sane, rational thing that any normal person would do: I watched and cataloged 1,000 ground balls.
I Would Watch 500 Grounders and I Would Watch 500 More
Behind pitchers and catchers, first basemen touch the ball more often than any other player on the field. Receiving throws is the overwhelming majority of their job, but we largely measure them the same way we measure the other three infielders. As such, I presumed for the purpose of this exercise that none of us know anything at all about first base defense and we must start from scratch. I decided to watch 100 received throws in 2020 from each of the following players:
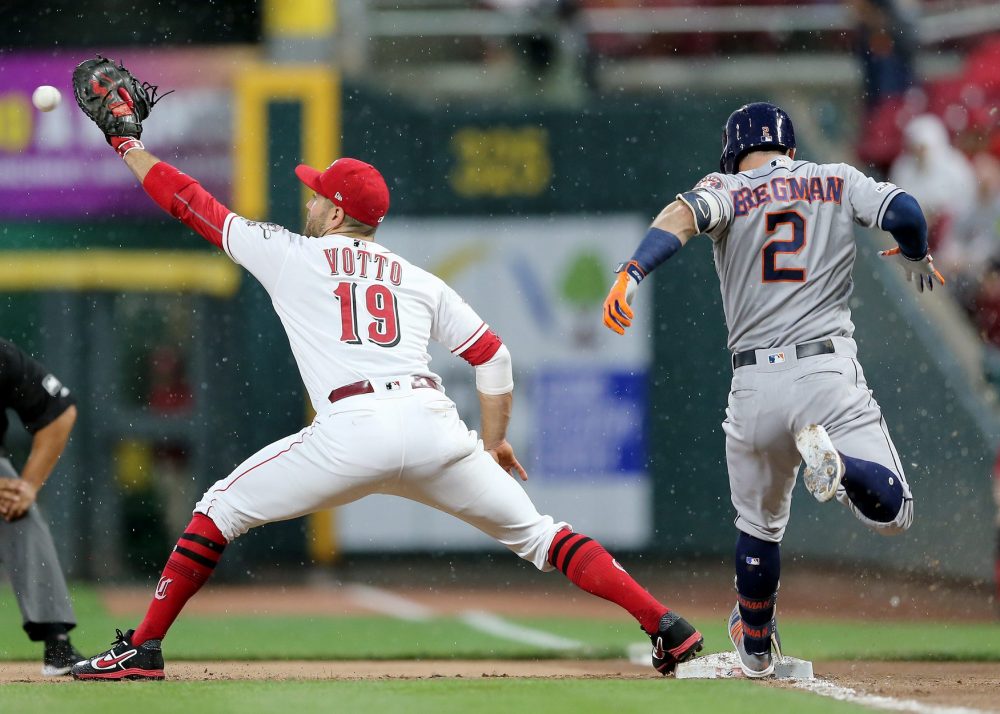
- The three best by FRAA: Matt Olson (4.7), Yuli Gurriel (4.6), and Joey Votto (3.7)
- The three worst by FRAA: Pete Alonso (-4.3), Carlos Santana (-4.2), and Justin Smoak (-4.0)
- The three tallest by listed height: Freddie Freeman (6’5”), Olson (6’5”), and Smoak (6’4”)
- The three shortest by listed height: Santana (5’11”), Gurriel (6’0”), and Jared Walsh (6’0”)
- The two 2020 Gold Glove winners: Anthony Rizzo and Evan White
With some overlap between categories, I had my ten subjects. Even in a 60-game season, each of them fielded far more than 100 throws, so I established the following search criteria for Baseball Savant’s video vault:
- All balls in play with a launch angle of fewer than 10 degrees (the Statcast definition of a ground ball). Yes, this left out some humpbacked liners that other infielders played on a hop, but that doesn’t matter. I just needed 100 throws received.
- No balls the first baseman fielded himself. Since we’re just focusing on how well first basemen catch throws from other fielders, any play in which he didn’t get that opportunity can’t be a data point. This also applies errors, infiled hits, and force outs at other bases in which no throw to first was attempted. However, all those such plays in which there was a throw to first were included in the data.
- The first 100 of the season. After the other two criteria were met, I used the first 100, starting from Opening Day on July 24. For a frame of reference, the everyday players in the study received their 100th throw sometime around August 10-12.
Warning! Fourth Grade-Level Mathematical Details Ahead!
Playing Catch
Let’s start with the basics. The first baseman’s job is to catch everything thrown their way, keeping one foot on the bag as often as possible. Of the 100 throws each of our ten players received, how many did they catch? How many became outs?
| Player | Out% | Catch% |
| Pete Alonso | 93% | 95% |
| Freddie Freeman | 91% | 98% |
| Yuli Gurriel | 94% | 100% |
| Matt Olson | 94% | 97% |
| Anthony Rizzo | 98% | 99% |
| Carlos Santana | 98% | 100% |
| Justin Smoak | 86% | 96% |
| Joey Votto | 94% | 97% |
| Jared Walsh | 91% | 96% |
| Evan White | 89% | 99% |
The big, obvious caveat in this table and all the data below is that not all throws are equal in catchability. A completed play requires both the fielder and the first baseman to succeed in their tasks, and sometimes one can bail out the other. The official scorer gave Gleyber Torres an E6 on April 7 and left Jay Bruce off the hook, but looking at catch and out rates for first basemen in a vacuum is the inverse of the same blind spot.
That being said, Gurriel, Rizzo, and Santana are absolute Hoovers, catching just about everything thrown their way and turning most of them into outs. Rizzo won a Gold Glove for his efforts and Gurriel finished second in MLB in FRAA, so they could have been expected to fare well in this experiment. Santana, though, was the shortest MLB first baseman last year (5’11”) and second-worst in FRAA (-4.2). One would think this means he has a small catch radius and limited flexibility. He came up as a catcher, so maybe those skills translate well to receiving at first base. A José Ramirez/Francisco Lindor/Cesár Hernández infield certainly doesn’t hurt.
On the other end of the scale, Alonso, Walsh, and especially Smoak didn’t comport themselves favorably. Smoak’s awful defense may have been a partial reason why he was cut by both the Blue Jays and the Giants, but it probably had a lot more to do with his .250 OBP and 77 DRC+.
White’s numbers show how these stats can be deceiving. His out rate was the second-lowest in the sample, but he caught every throw except one. Many of those catch/no out plays prevented a throwing error that would have allowed runners to advance, such as this one:
Even the one throw White failed to catch was a tremendous play on his part, knocking down and smothering a ball that would otherwise have sailed into the ether.
White catches pretty much everything, but evidently, these numbers don’t. His great play gets scored a no-catch, just the same as this Pete Alonso tragedy:
Clearly, catch and out rates don’t tell enough of the story. They’re probably no better than evaluating a shortstop using fielding percentage, but at least it’s a starting point.
Just Stretching
In middle school P.E. class, they used to make us sit in front of a wooden box with a ruler, then stretch out our arms as far as we could to test flexibility. MLB first basemen would surely score better than an out-of-shape 12-year-old. Stretching is just a pregame exercise for most players, but at the cold corner, it’s an essential job responsibility. The further a player can reach with their foot on the base, the more outs they can record.
Measuring catches and outs are definitive and binary, but measuring stretches is subjective. What one observer might consider a stretch, another might think is just a crouch. Each player has their own distinct style of stretching as well, further complicating data gathering. I did the best I could to be internally consistent, but some sloppiness is inevitably baked in. Here are three rudimentary stretch metrics:
- Stretch Attempts: The raw number of times each player stretched attempting to receive a throw. (Not that I’m one to judge; I haven’t stretched since eighth grade P.E. class.)
- Stretch-Catch %: The percentage of balls caught on stretch attempts.
- Stretch-Out %: The percentage of outs recorded on stretch attempts.
| Player | Stretch Attempts | Stretch- Catch% | Stretch- Out% |
| Pete Alonso | 44 | 91% | 86% |
| Freddie Freeman | 35 | 94% | 83% |
| Yuli Gurriel | 45 | 100% | 87% |
| Matt Olson | 45 | 93% | 87% |
| Anthony Rizzo | 30 | 97% | 93% |
| Carlos Santana | 44 | 100% | 95% |
| Justin Smoak | 32 | 91% | 63% |
| Joey Votto | 35 | 94% | 86% |
| Jared Walsh | 24 | 88% | 71% |
| Evan White | 38 | 97% | 71% |
Once again, Santana stands atop the heap while Walsh brings up the rear. The difference between them is striking given that they were MLB’s two shortest first basemen in 2020. One played with Lindor, the other with Andrelton Simmons. This probably should have been the metric in which they were most similar, yet they couldn’t have been more disparate. The difference could be due to some combination of style, flexibility, or sample randomness.
In general, more stretching is probably better. It may indicate the player is taking the extra step to make sure they beat the runner. Here’s an example from Santana:
The throw beats the runner by a full step. Grabbing the ball a tiny fraction of a second sooner didn’t make a difference in the play, but with a runner on third and two outs, he’s not taking any chances.
Not all stretches are helpful, either. Let’s pick on Walsh a little bit:
Yes, he’s stretching his legs in a straddle, but he doesn’t actually extend his arm forward to catch the ball cleaner. He’s not even stretching in the direction of the throw. All he’s doing is opening his five-hole wider so that if he missed, the ball would’ve rolled out of sight.
No one turned fewer stretches into outs than Smoak:
The throw from Keston Hiura is a smidge high, but Smoak displays the vertical skills of an elephant. White would’ve made that play every single time. Of course, the play was scored an E4.
Here’s the Scoop
The trickiest, most nuanced plays first basemen have to complete involve throws in the dirt. This is where they can make the biggest difference preventing errors and infield hits. Unfortunately, it’s also the smallest sample size of anything measured in the study. The metric definitions we’ll use are similar to stretches:
- Scoop Attempts: Any throw that bounces on the way to first, no matter whether it bounces an inch or ten feet in front of the first baseman.
- Scoop-Catch %: The percentage of balls caught on scoop attempts.
- Scoop-Out %: The percentage of outs recorded on scoop attempts.
| Player | Scoop Attempts | Scoop- Catch% | Scoop- Out% |
| Pete Alonso | 7 | 29% | 14% |
| Freddie Freeman | 1 | 0% | 0% |
| Yuli Gurriel | 5 | 100% | 80% |
| Matt Olson | 7 | 71% | 71% |
| Anthony Rizzo | 5 | 100% | 100% |
| Carlos Santana | 12 | 100% | 83% |
| Justin Smoak | 5 | 80% | 60% |
| Joey Votto | 3 | 67% | 67% |
| Jared Walsh | 7 | 100% | 29% |
| Evan White | 9 | 100% | 67% |
Unlike stretch attempts, the number of scoop attempts in the sample is entirely dependent on the other fielders. Kudos to the Braves for only bouncing one throw out of 100 to Freeman, even though it means we learned nothing at all about his scooping skills. Even for Santana, 12 isn’t nearly enough to make any firm conclusions. Regardless, the effect a great scoop has on a play is crystal clear. Here’s Votto looking sharp:
He won’t get credit for anything more than a boring old putout, but this is a top-notch defensive play. Conversely, here’s what happened to Olson when he misjudged a bounce:
This was ruled a single and an error on third baseman Matt Chapman, but a professional first baseman has to make that play. Instead of sealing the third out, Olson allowed the runner on second to score when the ball trickled away.
The difference between good and bad scoops is undeniable. If this sample is indicative of scooping ability (a very big “if”), the fact that Olson owns a pair of Gold Gloves underscores how little we tend to value such a critical skill and supports the hypothesis that we really know next to nothing about first base defense.
A Learning Experience?
1,000 ground balls later, there still isn’t enough data to prove anything meaningful. We still don’t know who is or isn’t a good receiving first baseman, but we have learned that it can be a significant factor in the outcome of a ballgame. If you came here looking for a spiffy new defensive stat, I’m sorry to disappoint you, but I will suggest three takeaways:
1. Evan White is Special
1,000 grounders include plenty of good, bad, and ugly, but White is several cuts above his peers defensively. Aside from outstanding natural reflexes and athleticism, what really sets him apart is his technique. He excels at keeping his glove hand level, lowering his body to receive the throw at his chest rather than dropping his glove into a less stable position. Often, his left knee touches the dirt to help him get as low as possible without dipping his glove:
Even though 2020 was his rookie year, this feels like a positioning breakthrough. Coaches and players at all levels should study this technique. I hope he figures out how to hit because watching him in the field is a treat.
2. Not Rated “E” For “Everyone”
First base is a uniquely challenging defensive position that requires a skillset unlike any other in baseball. Yet for as long as there have been lumbering, lead-footed sluggers, first base has been their default position. Bad first base defense has a real cost, even if it only shows up in box scores as throwing errors by their teammates or an increase in infield singles.
Does that mean the Mets should bench Alonso? Of course not. However, the Yankees should probably have considered a better defensive option before shoehorning an outfielder like Jay Bruce into the job. Failing to do so cost them at least one game in the standings.
3. We’re Not As Smart As We Think We Are
For thousands of years, the scientific community believed mayflies had four legs just because Aristotle said so. It was only a few hundred years ago that someone finally counted the legs and confirmed that there are actually six, just like all other insects. Baseball’s hive mind spent a congruent amount of time believing we knew how to measure ballplayers, then just a few decades ago, the analytics community finally started noticing what was right in front of us all along.
For as much as we’ve learned and subsequently pat ourselves on the back, there’s still a huge unexplored trench of baseball knowledge. We will always have more to discover. Measuring the value of one of the most basic elements of the game remains a mystery. In many ways, we’re still closer to Jay Bruce than Evan White. Even though what we’ve accomplished is admirable, sometimes a ball in the dirt crosses us up.
Thank you for reading
This is a free article. If you enjoyed it, consider subscribing to Baseball Prospectus. Subscriptions support ongoing public baseball research and analysis in an increasingly proprietary environment.
Subscribe now