This article was originally published on June 4.
Theo Epstein has a new job. Instead of trying to fix a franchise doomed to irrelevance, he’s now taken on the task of repairing baseball’s aesthetics. Epstein has some formidable challenges ahead of him and touched on them in a recent interview with Bob Nightengale, including mentioning the dominance of pitching, modern reliever strategies, and hitter approaches.
In summing up, Epstein said, “So, it’s a bit of a vicious cycle where the pitching is so good, the defensive positioning is so good, that hitters prioritize the home run and not two-strike approaches or using the whole field.” Of the factors he mentioned, defensive positioning may attract the least attention relative to its massive impact on the game’s evolution. An analysis of fielding since 2016 shows that batted balls that used to be dropping for hits have become outs instead, thanks to a new alignment that pushes outfielders closer to the wall. The result is that, even ignoring the impact of the shift entirely, the league’s improved positioning has taken away hundreds of extra-base hits.
Last week I looked at the way MLB defensive positioning has adapted since the earliest years of data availability. Across the board, fielders at every position have backed away from home plate, a change so pervasive and consistent it was unlikely to come from chance alone. I found that two positions were affected more than any other–third basemen and center fielders–and that those two positions, perhaps not coincidentally, have also driven the greatest share in the decrease in BABIP since 2015.
But although there is a correlation between which positions moved the most and which areas of the field saw the largest declines in hitting, more evidence is necessary to show how defensive efficiency has changed the game. Especially in an era when parameters of the baseball itself are changing, from air resistance to exit velocity, it’s necessary to take a more granular look at whether the same batted balls are becoming hits less often than they used to.
The effort to determine how teams are improving their defensive tactics is hampered by lack of data. Statcast generates the initial position of each fielder for every single play; there’s no reason these starting positions couldn’t be output as extra columns in the data on Baseball Savant. It would then be possible to measure the performance of different positioning directly, instead of approaching it sideways, as I’ve done here.
We do get an indicator of where fielders were standing simply in terms of whether an out was made on the play or not. If formerly unfieldable baseballs are now falling into gloves instead, that suggests that either athletes have become much speedier than they used to be or teams have optimized their positioning. (And based on sprint speed, there’s no evidence that fielders have gotten faster since 2015, though we can’t rule out better arms or hand-eye coordination.) To analyze this question, I built a model that predicted whether a given batted ball was a hit or out, depending on the launch angle, speed, and the extrapolated spray angle, as well as the home park. (I excluded home runs from the data, to eliminate the effect of a more aerodynamic baseball.)
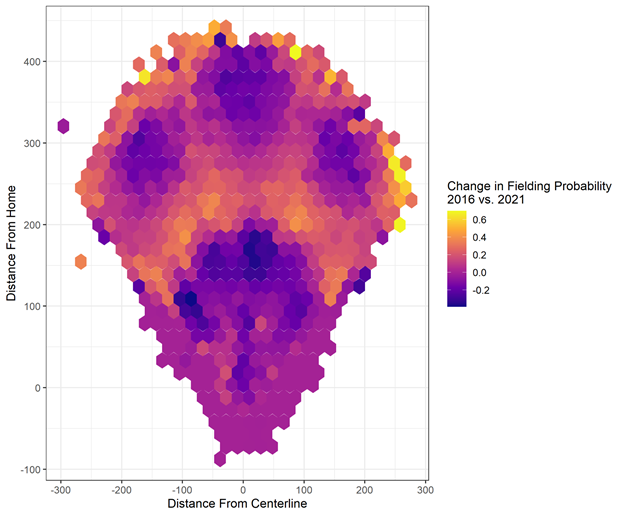
Here’s the result of this model: a map of the field, based on the landing position of each batted ball, colored by whether the ball is easier or harder to field in that area. More purple cells indicate that a batted ball to that area is more likely to be an out in 2021 than in 2016. More yellow/orange areas indicate the converse.
The most violet areas are all in the infield, which fits with our knowledge of shifts depressing BABIP. Three areas in particular stand out. From left to right: the normal positioning of the third baseman, which has dropped back 10 feet since 2015; the area around shortstop to the left of second, where shifted hitters find a wealth of defenders; and third, right up the middle, a formerly surefire place to get a hit that has become unproductive.
The outfield, also, is a sea of purple, suggesting that defensive positioning there has improved fielding. But the area between the infield and outfield highlights a rare section of greater offensive production. To see this better, here’s a one-dimensional representation of the chart above, with distance from home on the x-axis and change in out probability on the y axis.
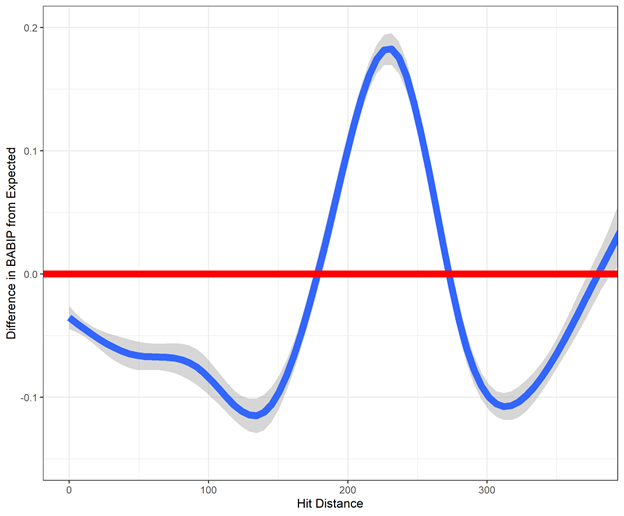
Anything below the red line indicates that batted balls at that distance are easier to field in 2021; above indicates batted balls that are harder to field. Most of the range of distances out to outfield walls is below zero, but one particular area–going from about 175 feet to 275 feet from home–has actually seen higher BABIP this year.
This area is exactly what you might think would be affected by fielders backing up, as I saw in the last article. If the outfielders retreat a few feet, they have a greater distance to travel on bloop hits between the infield and where they stand. But they also have a greater ability to field on balls hit further away, from about 275 feet onwards.
The reason teams may be OK with trading some BABIP on texas leaguers for reduced production further out is that there’s much more offensive value on batted balls deeper in the outfield. In total, batted balls in the 275-foot-plus area are about 60 percent more likely to be doubles, three times more likely to be triples, and five times more likely to fall for sacrifice flies than those nearer in (175-275 feet). What teams have done is essentially take away the extra base hit, at the cost of allowing slightly more singles. (The other reason the tradeoff works is that there are just more batted balls further out: about 24 percent of batted balls travel 275 feet or more, compared to 19 percent from 175-275.)
It’s a choice that makes sense for the current K and HR-heavy era. Singles become less valuable the lower the probability of moving a runner over becomes. As overall batting average declines, it causes bloops to become minor inconveniences to pitchers, rather than the beginnings of high-scoring, multi-run innings.
The findings here support the idea that teams are consciously backing up their fielders to improve overall defensive efficiency and suppress the most dangerous kind of offense, extra-base hits. They also showcase the exact kind of vicious cycle Epstein alluded to in his quote: by taking away doubles, triples, and sacrifices, teams incentivize hitters not to put the ball in play. Why bother getting on base when the main way to score is via home run?
The model predicts that there would be 1000 more hits this year if we had the same defense in 2021 that we did in 2016. With 1000 more hits on the field, we’d be on track for the highest BABIP (.314) in many years, which accords with the spike in hard contact and exit velocity. Batters are putting the ball in play forcefully when they don’t strike out; it’s just that defenses are better than ever able to convert those hard-hit balls into outs. Prorated over the full year, there would be about another 3000 total hits.
We tend to think of shifts as the dominant, new defensive tactic of the last decade. I’ve argued before that this viewpoint is mistaken: infield shifts are extremely visible, but the case for their efficacy is mixed. They probably reduce BABIP, sometimes, but may exact an offsetting penalty that makes the overall effect on offense minimal.
This analysis suggests shifts are more like the tip of a defensive efficiency iceberg that’s walloping offense across the league. What the new tracking system provided was fine-grained data on where the ball went and where fielders stood and moved: all the ingredients necessary to optimize fielding. Front offices across the league used those ingredients and we can see a shift in positioning as a result–and a shift towards lower BABIP, accompanied by a tradeoff that suppresses XBH. The details about when, how, and why teams position their fielders are obscured by lack of data, but no less impactful.
As BABIP creeps ever lower, it’s clear that the same kinds of hits are not yielding the same offensive value as they used to. Baseball is grappling with the confluence of multiple analytics-driven trends, from an explosion in sabermetrically-optimized sticky stuff to a defensive positioning revolution to an increasingly all-or-nothing hitting philosophy, all of which combined threaten to extinguish the flickering candle of offense that hitters still present. Epstein can help to arrest these trends, but it may take a heavier-handed approach than the league has been willing to wield so far.
Thank you for reading
This is a free article. If you enjoyed it, consider subscribing to Baseball Prospectus. Subscriptions support ongoing public baseball research and analysis in an increasingly proprietary environment.
Subscribe now