COVID-19 has upended our society, and the world of professional baseball is no different. Major League Baseball teams are playing games in front of cardboard cutouts instead of screaming fans. Several batters and pitchers opted out entirely. Several umpires also opted out, creating an unprecedented amount of turnover under extraordinary circumstances.
Perhaps not surprisingly, the 2020 season started off with several surprising differences: Batting Average on Balls in Play (BABIP) began at an all-time low, although it has started to improve. Run-scoring plunged as well. On the other hand, walk rates started out historically high, at levels not seen since the steroid/expansion eras of baseball. If this were just a story of suppressed offense—of pitchers dominating hapless, unprepared hitters—we would not expect hitters to be getting on base more in such a fundamental area of the game.
This suggests that something more fundamental has been at work, something that could have a variety of effects on different aspects of the game: the strike zone. It turns out that the strike zone for the first two weeks of 2020 was called differently than the zone called over the first two weeks of 2019. While some of these differences have subsided, others persist. Together, they tell a story of transition and adjustment under unprecedented challenges.
Strike Zones: an Overview
Previous research has documented the increasing size of the zone since the PitchF/X optical pitching tracking system was first publicly introduced for the 2008 season. Between 2008 and 2013, the strike zone expanded as umpires called more and more strikes at the bottom of the zone. A strike zone that nominally extended only to the top of the knee was now extending more toward the hollow of the knee. For batters not named Mike Trout, this extended bottom of the zone is a difficult place to make effective contact, resulting in more swings that are less effective. Jon Roegele documented a corresponding decrease in run-scoring over this same time period.
In 2017, MLB shifted to the Trackman radar system of pitch tracking.The bottom of the strike zone rose back up a bit, although it remained lower overall than its 2008 average height.
How about the 2020 season? Some have claimed that the strike zone is larger this year, but that is not quite right. Compare this overlay of called strikes between 2019 and 2020, after the first two weeks (about 32,000 called pitches) of each season:
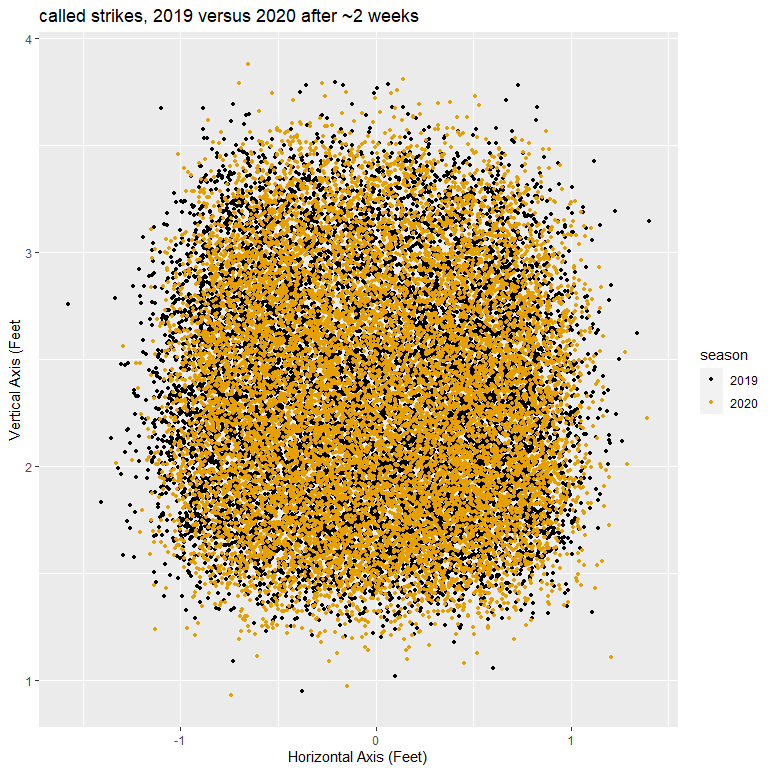
Early 2020 did not, in fact, seem to have more extreme pitches overall than 2019: There are plenty of outliers in both seasons in all directions.
But even after the first two weeks, two changes were apparent. First, using BP’s PitchInfo data, which corrects for ballpark biases and other factors, the average called strike is occurring slightly further to the right (positive movement) relative to the first two weeks of 2019. This change in theory could be meaningful, but then again, we are talking about a third of an inch or so, and other factors like pitch mix or batter tendencies could be in play as well.
Second, umpires also began the season by calling strikes at a higher rate than in 2019 (39 percent versus 38 percent). We estimate only a four percent probability1 that this difference happened by chance. However, as of the seven-week mark, the called strike rate for 2020 is heading back toward the 2019 strike rate. As we discuss below, this brief surge in called strikes has a likely cause.
Participant Effects
To analyze further effects, we need to take a more sophisticated approach.
There are multiple factors driving a called-strike decision that go well beyond the location of the pitch. Teasing them out requires a formal strike zone model, and as it so happens, our catcher framing models are designed to isolate these sorts of contributions. Beyond the general likelihood of a particular pitch being a strike—a separate calculation derived from pitch location and various associated factors (pitch type, batter handedness, etc.)—we account for the following additional factors:
- Home field effect
- Closeness of the score
- Batter Identity effect
- Pitcher Identity effect
- Catcher Identity effect
- Umpire Identity effect
For this analysis, we added one new effect we have not consistently tracked before:
- Catcher-umpire combination effect.
The reason for this addition will become clear.
Over the first few weeks of the season, our framing models—which are designed for speed and high pitch volumes—struggle to capture the precise values of these factors. For maximum accuracy, you need to use a fully Bayesian approach like Stan or INLA. Full Bayesian approaches are challenged by the sheer volume of pitches that pile up by the end of a baseball season. However, over the first several weeks of the season, they are a superior approach. For our analysis here, we will use INLA, which is known to be particularly accurate.
Having respecified our framing model for INLA, we found some extremely interesting things.
The Home Field Advantage
We start with the effect of home field.
In virtually every sport, there is an advantage to being the home team. Baseball is no different. Michael Lopez, currently Director of Data and Analytics for the National Football League, recently estimated that home field in baseball makes winning four percent more likely, all other things being equal. This effect extends to multiple areas of the game: Hitters hit better at home and pitchers pitch better at home. Not coincidentally, away-team batters get more strikes called on them than home-team batters do.
Of course, this year should be different, right? With no fans to pressure umpires, who otherwise have no connection to any particular venue, we might expect the home field advantage to essentially disappear. Indeed, Mike Petriello noted in mid-August that home teams had at that point shown no home-field advantage at all. Since then, the home-field advantage seems to have rebounded to the usual four percent effect.
How has this played out in the strike zone? Consider a borderline pitch that otherwise has 50 percent called strike probability. With all other things being equal, what would be the effect of that pitch getting taken by a batter on the home team versus the visiting team? Starting with the first two weeks of both seasons, let’s look at the difference between this year and last year, accounting for the uncertainty of our model estimates:
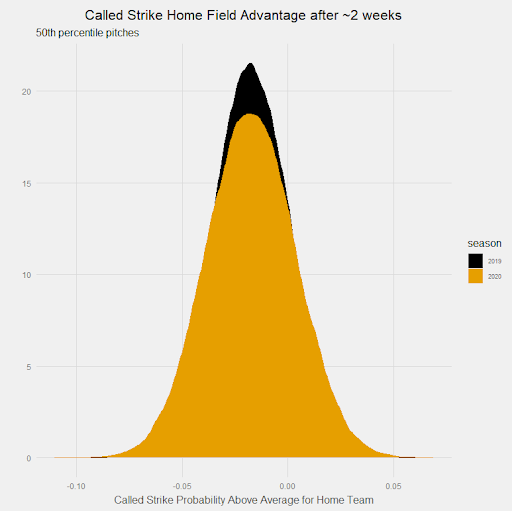
They are almost exactly the same! In both years, home-team batters are just under two percent less likely to have a strike called on a borderline pitch. The initial effect of the absence of fans on umpire strike zones appears to have been: essentially nothing, at least in the aggregate. This cannot be written off simply as a sample size issue: there were ~32,000 called pitches in the first two weeks, and these density plots include the uncertainties around both estimates. We can be virtually certain there was no net difference, for whatever reason.
Since that time, the trend has been more of what we would expect: a declining home-field advantage versus 2019. Here is the comparison as of seven weeks into both seasons:
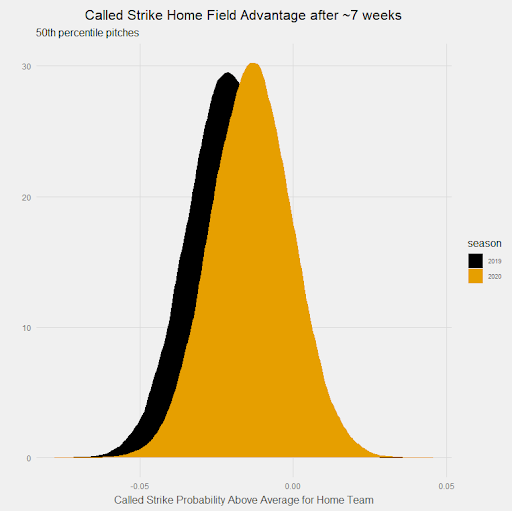
We are starting to see the divergence, now that we have about 90,000 pitches thrown. We estimate there is only a 65 percent chance that the 2020 home-field advantage, as it pertains to the strike zone, is in fact different from the 2019 home-field advantage.
What is perhaps more interesting is that the 2020 home-field advantage is still highly likely (~85 percent) to be less than zero: In other words, it probably still exists. This is a puzzle in and of itself: Without fans, why would umpires care which team was playing at home? The primary vocal pressure now comes from the dugouts, and judging by some of the early-season fireworks, both sides’ dugouts seem to be equally capable of getting under a home-plate umpire’s skin. And yet, home-field teams continue to get the better of these calls.
Umpire Variance
As it turns out, the most important change to the strike zone was brought by the umpires themselves. As noted above, there were 10 new major-league umpires this year, driven largely by opt-outs from existing MLB umpires. What happens when you add a bunch of new umpires to an already highly-altered game environment? This:
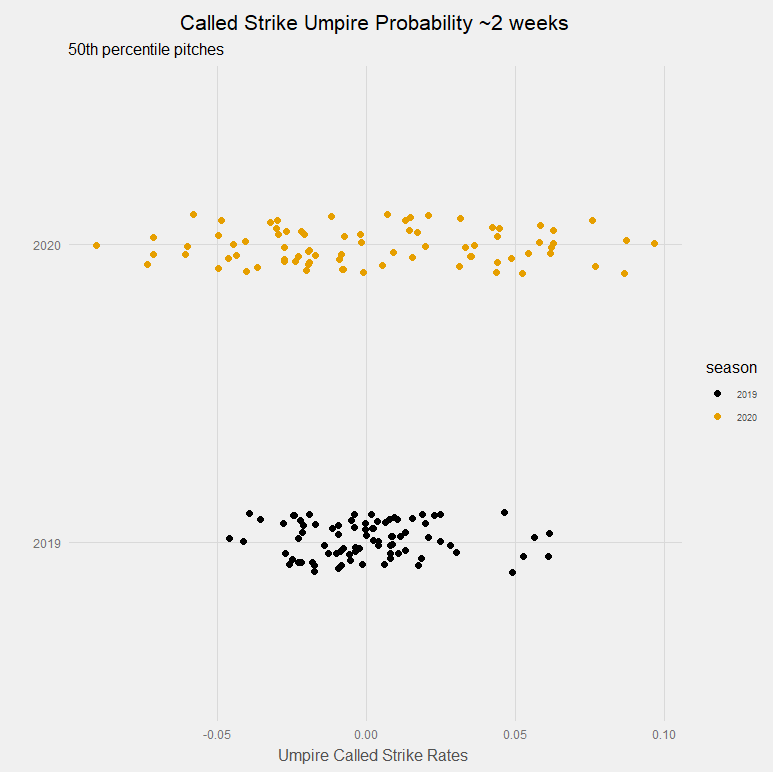
The initial variance between umpires this year was massive.
After two weeks of the 2019 season, the probability of a called strike on a 50th percentile pitch varied between home-plate umpires from around -5% to +7% versus average. For the first two weeks of the 2020 season, the average called strike rate among home-plate umpires ranged from about -10% to +10%, nearly double the range among 2019 umpires.
Typically, the probability of a pitch being a strike, accounting for pitch characteristics and location, is roughly equally affected by batter, pitcher, umpire, and catcher. At the beginning of 2020, however, the identity of the umpire outpaced the relevance of all these other effects. So if you had a hard time trying to figure out the strike zone early on this season, just imagine how the players felt.
Fortunately, this divergence has largely gone away:
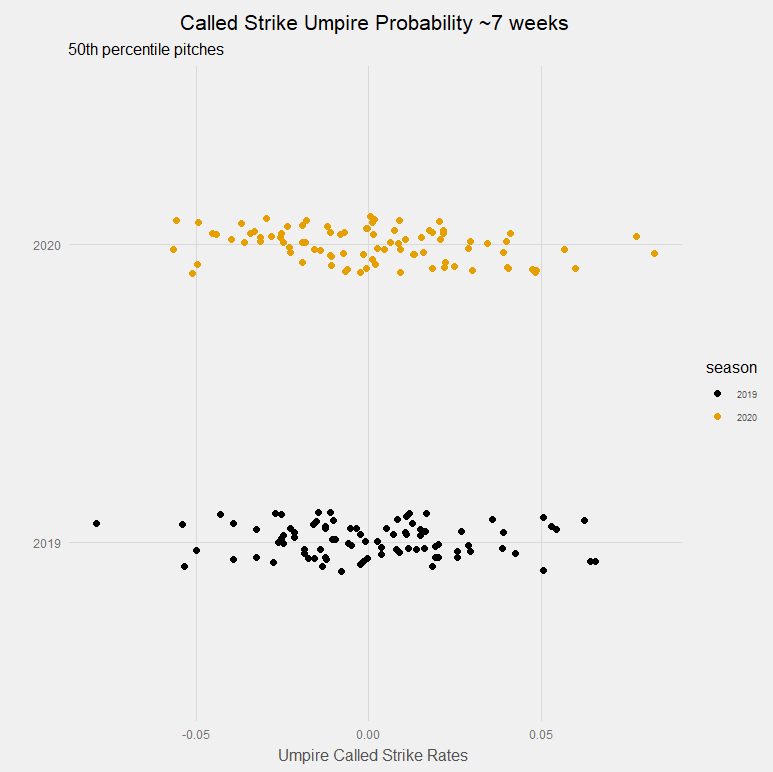
Umpires in 2020 still have slightly more disagreement versus their 2019 counterparts, but not by much. The fact that it is even that close suggests either a concerted effort to put all umpires on the same page or perhaps that umpires just adjusted to the new environment and reverted to a more natural spread of tendencies. The narrowing is arguably even more dramatic than shown given that the first two weeks of the season were already baked in. We do have a few 2020 home-plate umpires who continue to call strikes at an unusually high rate.
Catcher-Umpire Coziness
There is one more possible piece to the puzzle: Due to travel restrictions, particular catcher-umpire combinations have been spending more quality time earlier on in the season than before.
As Rob Arthur found a few weeks ago, historically, a catcher’s ability to get strikes from a home-plate umpire has grown with the amount of time spent in front of said umpire: the more called pitches, the more strikes are called. The effect grows up until the first 125 pitches or so and then levels off. As Rob noted, usually catchers get about 100 called pitches total over a season with a given home-plate umpire, but due to travel restrictions many had already hit 70 pitches by mid-August in 2020.
Perhaps that early-season quality time creates a unique confounder for the strike zone? Look at the magnitude of the effect of catcher-umpire interaction after two weeks of 2020 versus two weeks of 2019:
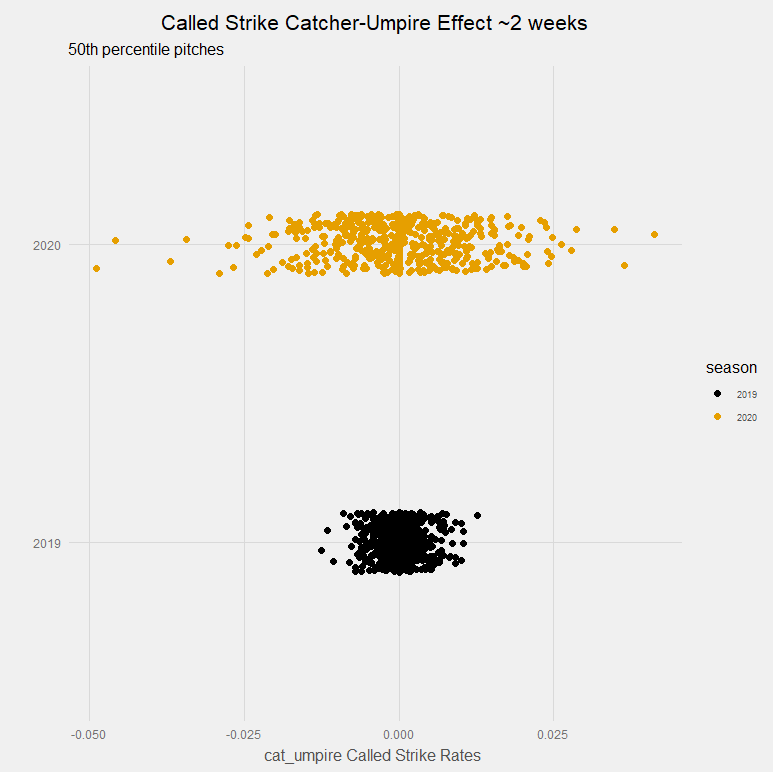
The effect is staggering. Catcher-umpire variance—which, to be clear, is a measurement tracked in addition to the umpire effects shown above—is a massive driver of variance in called strikes over the first few weeks of the 2020 season. Furthermore, there is also evidence that this was an acceleration of a known effect rather than something entirely new. Compare, for example, what has happened in both seasons once we get to seven weeks:
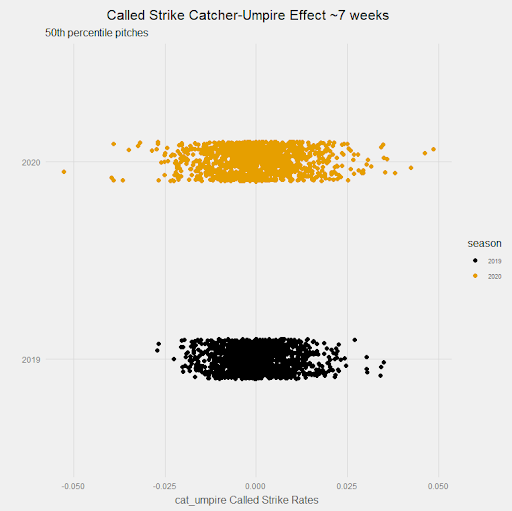
The effect of catcher-umpire familiarity is rapidly converging toward the 2019 rate, although it is not quite there yet. This accelerated familiarization process would appear to be a critical part of the story for the early 2020 strike zone. It also may explain why the home-field advantage may at first have not seemed to be much different at all: Catcher-umpire and individual umpire effects may have been dominating other factors at the time.
Conclusion
Major League Baseball has been very different in 2020, and complaints about the perceived strike zone have been widespread.
We conclude that, on average, the 2020 strike zone is actually very similar to the 2019 strike zone overall. Much of the perceived variability in strike-calling appears to have been (temporarily) driven by individual umpires who, like the players, were experiencing a completely different playing environment in addition to dealing with considerable turnover in their ranks. In turn, those umpires were spending an inordinate amount of time behind the plate with the same catchers, who may have become more rapidly acclimated to these (admittedly adapting) umpires than they otherwise might have done. With catchers and umpires having now reached the “familiarity plateau” more quickly, the outsized 2020 effect of catcher-umpire interaction appears to be converging with the more traditional spread we saw during 2019 around this time.
With respect to home-field advantage, the recovery of the overall home-field advantage for teams makes some sense: Batters and pitchers might enjoy being home more than ever, although the persistence of that four percent effect this season suggests that fans may not play as much of a role in home-field advantage as commonly suspected.
But left unexplained is the persistence of home-field advantage in called strikes by umpires, who are on the road at virtually all times. The slight decline in the called-strike home-field advantage may be consistent with the loss of fans in home team stadiums. But the fact that this home-field bias nonetheless continues even without fans, and remains mostly intact, is puzzling. We are at a bit of a loss to understand why this is, but it could mean that called-strike home-field advantage, at least with the strike zone, may primarily be driven by still some other quality we have not identified here.
The unique effect of the COVID-19 pandemic on umpires, and catcher-umpire interactions, is nonetheless a critical takeaway from this analysis. Umpires were challenged at first to adjust to baseball under unusual circumstances, and catchers appear to have been paying close attention to the adjustments umpires were making. Much of which may have seemed like a different strike zone early on in fact may have just been an adjustment period. Arguments that the strike zone somehow remains different from 2019 may be unduly influenced by the unique circumstances presented by the first two weeks of the 2020 season.
1Strikes were called on nearly 39 % of pitches for the first two weeks of 2020, and just over 38% of pitches over the same time period in 2019, with just under .003 SD in both years.
Thank you for reading
This is a free article. If you enjoyed it, consider subscribing to Baseball Prospectus. Subscriptions support ongoing public baseball research and analysis in an increasingly proprietary environment.
Subscribe now
I would expect that if there were a significant home/road split in taking pitches, it would have been noted years ago, and I don't recall seeing it. But has anyone looked at this year? Are batters leaving a different selection of pitches for the umpire to call, based on home/away?