This article is part of the launch for Baseball Prospectus’ new hitting statistic, Deserved Runs Created, which you can learn much more about here.

Nearly every season ends with a ritual battle between two fierce, opposing teams to crown baseball’s champions. Tempers flare, fighting words are exchanged, and fan bases nearly come to blows. No, no, not the World Series; I’m talking about the annual debate between the sabermetricians and the old-school baseball fans about who should be MVP.
Part of the fire and fury of these contests springs from the clean certainty of Wins Above Replacement. The all-inclusive value metric gives fans and writers an unreasonable confidence that one player is better than another. But the release of DRC+ reminds us that in assessing the most valuable players in baseball, we ought to be circumspect rather than certain.
The debate tradition goes back decades in some form, but began to escalate in earnest in 2012, when Mike Trout blew past Miguel Cabrera in Wins Above Replacement, but failed to match Cabrera’s Triple Crown. The 2012 debate was particularly acrid. One prominent national writer called Trout “the only rational choice”; another likened Cabrera voters to 9/11 Truthers. The opposite camp coined the phrase “vigilante sabermetric brigade” to describe people they thought of as never even watching the games. (Out of an abundance of respect for the people involved, I’m declining to name names.)
In what was perceived as a great injustice to the sabermetric movement, statistics, and perhaps data itself, Trout lost the MVP that year. To add insult to injury, he lost again the next year under similar circumstances.
Deserved Runs Created creates an opportunity to revisit that travesty. We can actually measure just how wrong the voters got it those two years.
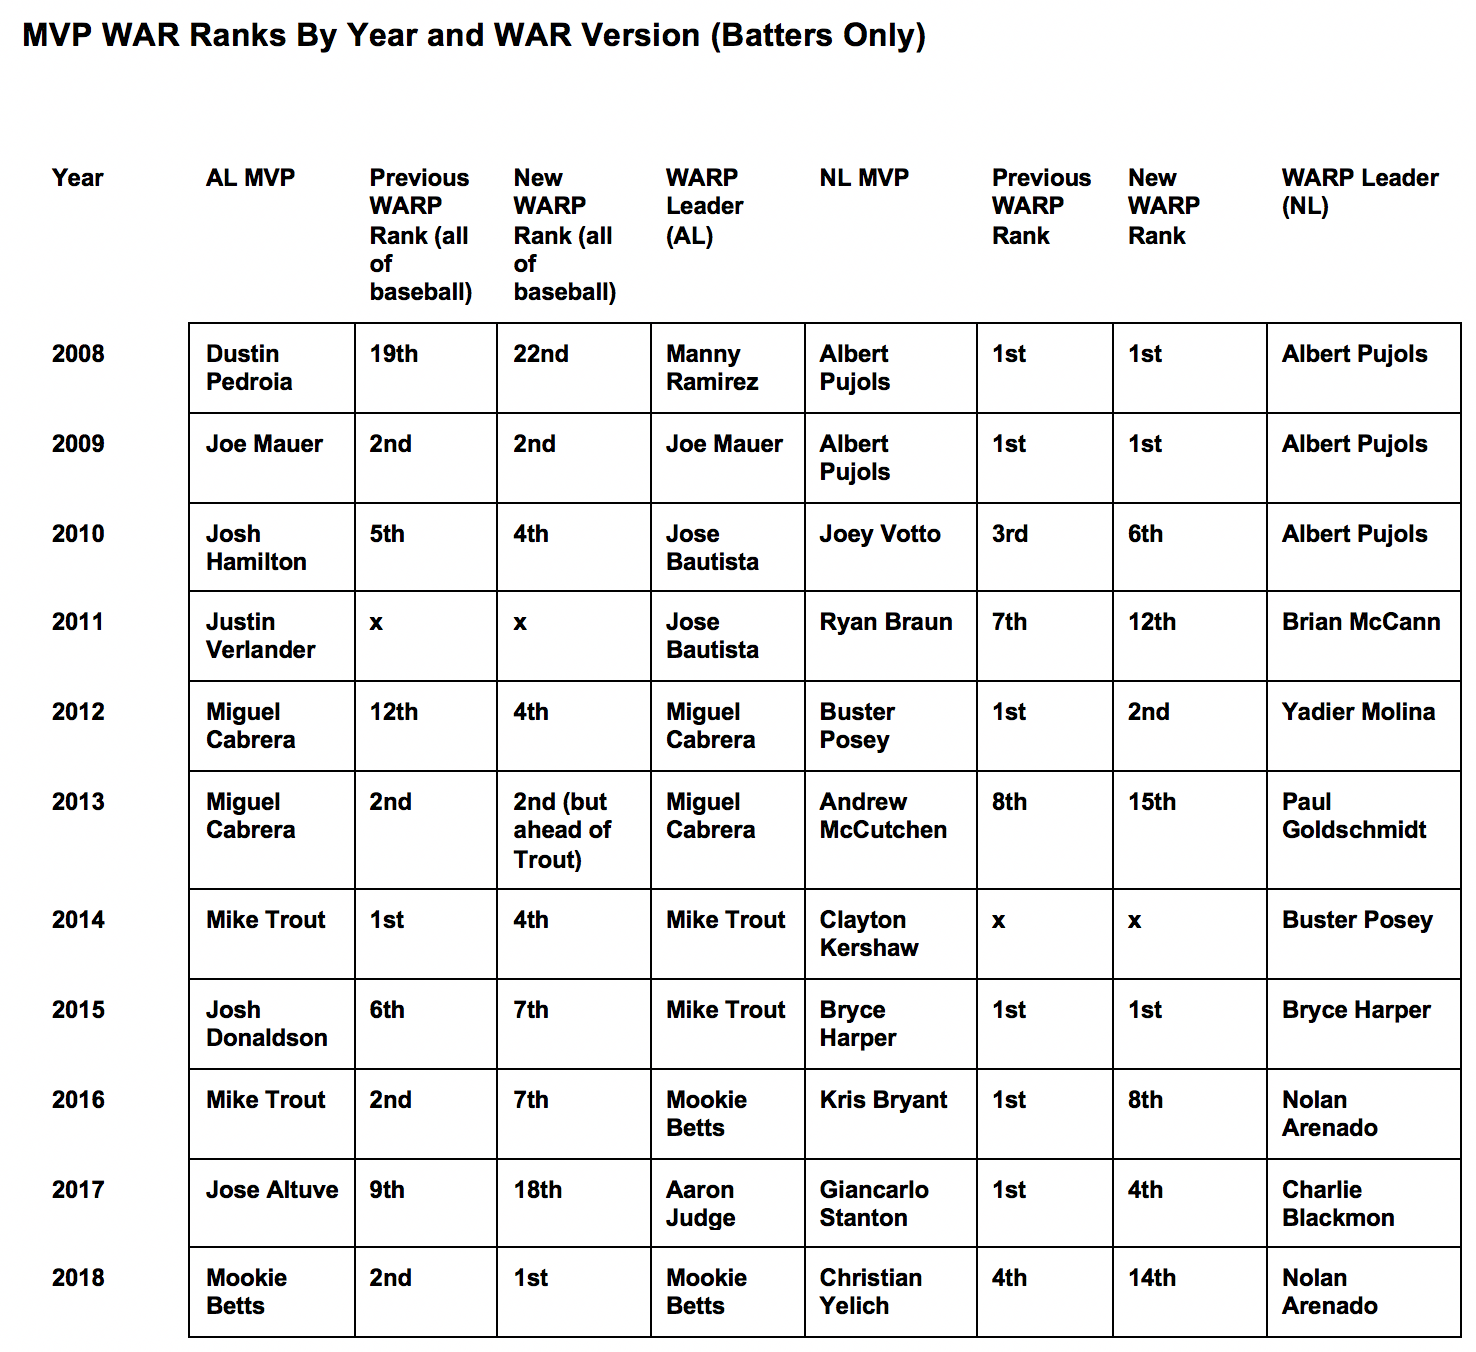
Except the answer isn’t as clear with the most advanced batting statistic available to us. According to DRC+-based WARP, Trout wasn’t even among the five most valuable players in baseball in 2012, and Cabrera surpassed him again in 2013. (For more on those 2012 and 2013 MVP races, read Matthew Trueblood’s article from earlier this week.)
Nor were 2012/2013 exceptional. A cursory look at the MLB leaders in the old and new versions of WARP each season shows that DRC+ frequently changes how we would have thought about the MVP races.

Beyond Trout and Cabrera, there are lots of juicy and contentious arguments to be had within this table: was Yadier Molina really better than Buster Posey in his MVP season? How many times have Rockies hitters been robbed of their rightful honors?
But the point of this column is not to question the decisions of MVP voters or to resurrect the arguments of years past. It’s to challenge the framing of the debate surrounding the award. Because WAR is such a neat summary of a player’s worth, some writers and fans alike have taken it as gospel: a fixed, perfectly certain number, like batting average or home runs. It follows from this reasoning that there’s exactly one right answer to the question of who deserves to be MVP in each league. Those who don’t ascribe to this answer must be wrong.
But like all statistics, WAR is uncertain. Our best estimates say you can only know a player’s WAR to within about plus or minus one win—easily exceeding the margin in many MVP debates. Within that threshold, the most we can say is that one player is probably more valuable than another. DRC+ is unique among major value metrics in providing the standard deviation around each player’s measured value, making that uncertainty visible.
Beyond that, WAR is subject to constant revision. DRC+ is the most recent example, but BP isn’t alone in updating WAR or its components. FanGraphs made changes to UZR in 2018, which impacted WAR significantly. Baseball-Reference updated its version several times from 2009-2013. Like all statistical models, WAR can be improved upon. And when those changes are made, the clear MVP frontrunner can become just another also-ran.
Given the variability and uncertainty within WAR, you would think sabermetrics-inclined partisans would learn to temper their arguments. But the heat from the 2012 debate has never truly died down. Some were ready to declare the 2016 vote a farce if Trout didn’t win that year. To this day, you’ll find sabermetricians calling the opponents of a given candidate (usually Trout) not just wrong, but stupid.
There’s a case to be made that MVP awards and similar honors shouldn’t be bestowed unless there’s a significant consensus in favor of one candidate or another. Most years, there’s a clear separation between the top tier of players and the rest, but very little between the best and second-best player in a league. Arguably, in cases like these, the honor should be shared, rather than granted to the one person whose boosters build the strongest case. At minimum, it shouldn’t be treated as a terrible decision to vote for or support a candidate with a WAR total one or two below the current leader.
The fury extends beyond the annual award arguments. The sabermetric community was absolutely certain that pitchers couldn’t control the results of balls in play—until it turned out they could, at least to a limited extent. The same confidence was on display about the nonexistence of hot streaks and the effectiveness of shifts, to name two other favorites that have been challenged in recent years. And yet the ferocity with which some saber-inclined writers swat down mentions of hot streaks is undiminished.
The sabermetric movement sprang from the idea that we could analyze and quantify baseball better than it had been done before. At first that meant discarding less accurate metrics like errors in favor of better ones like UZR, or challenging the wisdom of an obviously boneheaded play (for example, some sacrifice bunts). Today, with errors far in the rear-view mirror, further improvements will necessarily come at the expense of modifying cherished pillars of sabermetrics itself, like the components of WAR.
Everything we think we know about baseball right now is subject to debate and revision. As our numbers and methods advance by leaps and bounds, some of the sacrosanct ideas of sabermetrics—like Mike Trout’s perennial MVP candidacy, or the nonexistence of hot streaks—may end up being discarded. The sabermetric community ought to temper our numbers-driven certainty with the knowledge that we are always one breakthrough away from being wrong.
Thank you for reading
This is a free article. If you enjoyed it, consider subscribing to Baseball Prospectus. Subscriptions support ongoing public baseball research and analysis in an increasingly proprietary environment.
Subscribe now
It would be interesting to find out more about the Cobb/Blue case you pointed out, though.