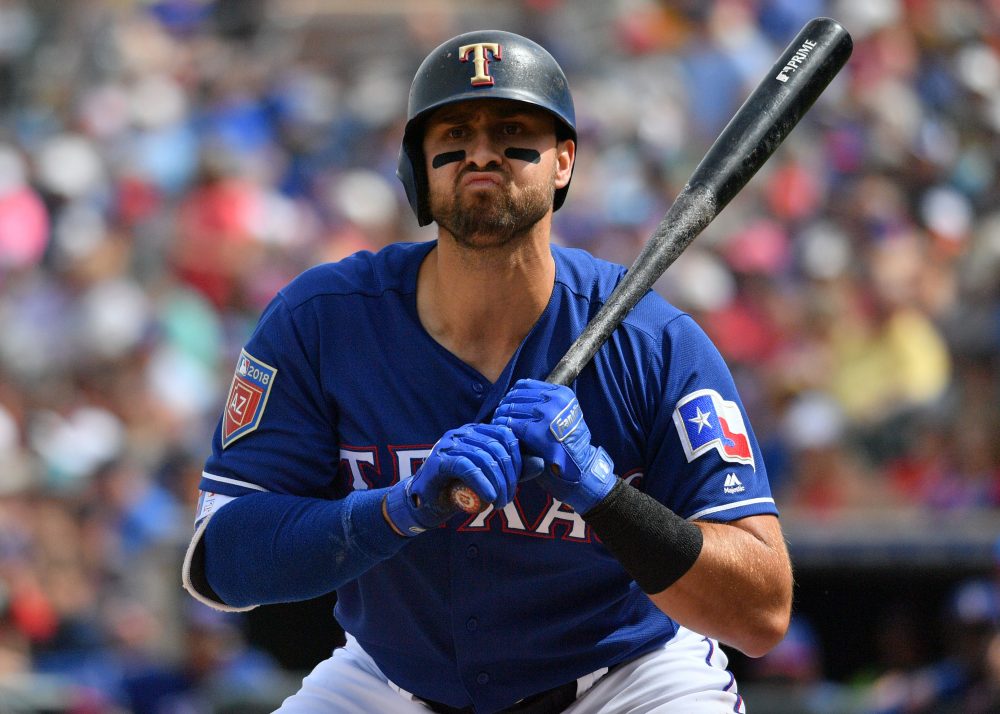
Those crazy Astros were at it again during opening weekend. Facing off against the rival Rangers and their pull-happy port-sided power-hitter Joey Gallo, the Astros induced the most talked about pop-up to third base of the 2018 season. Or was it the most talked about fly ball to left field?
In the first inning, Gallo—who was batting second in the Rangers’ lineup—lifted a rather pedestrian fly ball to the left side that flew well into the grassy area beyond the infield. Waiting there—not sprinting for it, just calmly standing there waiting because he’d been there a while—to catch it was … Astros third baseman Alex Bregman.
Houston had deployed a four-man outfield for Gallo, with Bregman being the fourth wheel on the tricycle, and Gallo provided the early season favorite for the most perplexing “how do we score that?” decision of 2018.
It was a defensive alignment that produced one of the most astounding pictures of the day, via Brian McTaggart of MLB.com:
Peacock is so good Astros don’t need defenders pic.twitter.com/rm8A7wx6Xq
— Brian McTaggart (@brianmctaggart) March 29, 2018
In addition to the four-man outfield, the three remaining infielders (Carlos Correa, Jose Altuve, and Marwin Gonzalez) were all on the right side of the infield. There were no defenders at all between second and third base.
The next night, the Astros weren’t quite as extreme. With ground-ball generator Dallas Kuechel on the mound, Houston settled for a more conventional four-man infield, but Bregman (again playing third base) was generally stationed right behind second base. Still, the left side of the infield was Gallo’s if he wanted it. On Sunday, with Gerrit Cole on the mound, the four-man outfield appeared again. In the first inning, Gallo showed the Astros what he thought of it and hit an opposite-field home run. In the eighth inning, Gallo hit a ground-ball single to Bregman, who was once again playing in left field.
And so, a debate erupted. Should Gallo bunt? He’s had one sacrifice bunt in professional baseball, in 2014, at Double-A Frisco. But then, this is the same Gallo who hit 41 home runs last year for the Rangers. Should a guy who’s that much of a power threat really be bunting?
Warning! Gory Mathematical Details Ahead!
Oh hey, let’s ask Gallo himself about the issue:
Most people assume, there’s nobody on the left side, so just bunt it. It’s not that simple. It’s not that easy against a guy who is throwing 107 [miles per hour] with a ton of movement like [Houston’s Justin] Verlander. I don’t want to come out of my game to do it. If I bunt and don’t reach, it’s like “what the hell are you doing?” It’s kind of a lose-lose situation.
Gallo points out a few issues which are worth looking into. One is that bunting is hard (Justin Verlander or not), and the other is that it might not work. It may sound easy to say, “Just bunt it to the left side, no one’s home,” but it’s also not a guarantee that the ball will go to the left side. Then again, the kind of bunt that Gallo needs is different than a sacrifice bunt. The goal of a good sacrifice bunt is to deaden the ball so that the charging third baseman will have to come far enough and have his momentum coming toward the plate hard enough that he won’t be able to turn and plant and throw out the lead runner. But it also has to be far enough away from the catcher that he can’t just jump out and grab it and throw out the lead runner. It’s a tough bunt to execute.
Against the shift, there is no third baseman. He’s in left field. You just have to push the ball so that it goes past the pitcher and stays fair. By the time anyone else gets to the ball, you’ll be standing on first base with a single. So, how often can an inexperienced bunter lay down a bunt that at least goes fair?
I looked for batters from 2013-2017 for whom two things were true. One was that they logged at least 250 plate appearances in the season in question. The other was that they attempted one–and exactly one–bunt during that season. We have data on what happened to those bunts. They may have bunted and missed. They may have bunted it foul. It may have gone into play. I found 155 of these one-bunt wonders and 67 of their 155 bunt attempts (43.2 percent) resulted in making contact with the ball and the ball going fair.
To make sure that I didn’t just hit on some weird sample, I expanded things a bit to hitters who tried bunting one, two, or three times for the year. In that sample, 270 of the 637 bunt attempts (42.4 percent) went fair. What’s interesting was that I looked to see what happens when you investigate hitters who bunt more often.
| Sample | Fair Bunts | Bunt Attempts | “Success” Rate |
| > 250 PA, 1 bunt | 67 | 155 | 42.3% |
| > 250 PA, 1-3 bunts | 270 | 637 | 42.4% |
| > 250 PA, > 10 bunts | 5,282 | 11,553 | 45.7% |
| > 250 PA, > 20 bunts | 3,601 | 7,858 | 45.8% |
| > 250 PA, > 50 bunts | 727 | 1,690 | 43.0% |
| > 250 PA | 6,507 | 14,320 | 45.4% |
| Everyone! | 12,247 | 26.993 | 45.4% |
Guys who bunt more often are a bit more successful in making contact and steering it fair, by a couple of percentage points. It looks like bunting is just hard for everyone. So while Gallo might protest that he’s not practiced in the art of bunting, the evidence suggests that what he would likely perceive as a lack of success is not his inability, but is because of the difficulty of the task.
However, it means we do have to consider something else. Let’s assume that Gallo is the kind of guy who has a 42.3 percent fair contact rate on bunts, but that he decided no matter what he was going to bunt. If he missed one, he’d try again. You get three, after all. A simple binomial calculator says that given a 42.3 percent chance to make contact on an individual pitch and three chances to do so, he’d make contact on one of the three bunt attempts in 80.8 percent of his plate appearances. Well, that means 19.2 percent of the time he’d strike out trying to bunt like that, either by bunting and missing or bunting it foul.
Still, even if he does strike out a fair bit (Gallo tends to do that anyway), we also know that when hitters put the ball in play on a bunt against the shift, they have gotten a hit 58.2 percent of the time. Of course, they are mostly singles. Assuming that Gallo was only able to put the ball into play 80.8 percent of the time, but when he did it was a 58.2 percent chance of being a hit, that leaves us with a .470 batting average and probably a .470 SLG. (There might be a double or two if the ball scoots down the line, but let’s assume the worst case.)
Most people focus on the idea that a home run is better than a single. They’re right, and if there’s one thing we know will happen with a bunt, it’s that it won’t be a home run. But on the flip side, Gallo had a on-base percentage of .333 in 2017, meaning he would make far fewer outs with a “bunt all the time” strategy, and a single is better than an out. Is a .470/.470/.470 slash line enough to make it worth Gallo dropping one down? Or more to the point, trying to drop 600 down?
Here’s an important table. These are the linear weights values for batting events in 2017. For those unfamiliar with linear weights, they are a way of estimating the value of an event in runs. For example, a double brings a batter to second base, which brings his team closer to scoring. He might end up scoring, he might not, but that’s largely beyond his control. He should get credit for the increase in probability that his team will score. He may also have knocked in runners that were potential runs but are now real runs.
| Event | Value |
| K | -0.27 |
| BB | 0.31 |
| HBP | 0.33 |
| 1B | 0.45 |
| 2B | 0.74 |
| 3B | 1.03 |
| HR | 1.38 |
| Out in Play (OIP) | -0.26 |
It’s true that trading a home run for a single is a bad deal. The difference between the two on this chart is .93 runs of value, and bunting all the time means making that trade. But it also means trading some outs for singles, and that’s worth .71 runs. Trading a home run and an out for two singles is a losing proposition. You need about 1.3 outs turned into singles for every home run turned into a single. But we can also see that trading a double and an out for two singles is a winner according to the chart.
In Gallo’s case, that home run trade-off is going to be particularly important. Among batting title qualifiers in 2017, only Giancarlo Stanton homered in a higher percentage of his plate appearances than did Gallo. If a hitter is only a five-homer guy over the course of a season, no one worries about the homer he’s giving up by bunting. But if anyone is giving up a chance at a home run by bunting, it’s Gallo. Can he justify leaving that chance of a home run on the table?
Let’s look at Gallo’s real 2017 stats and what he would have produced in the same number of plate appearances (532), assuming our .470/.470/.470 performance in which he bunts all the time against a shifted defense. The “Total Value” column is the number of runs that each line would have generated (or did generate), based on the linear weights above.
| Player | PA | K | BB | HBP | 1B | 2B | 3B | HR | OIP | Total Value |
| Real Gallo 2017 | 532 | 196 | 75 | 8 | 32 | 18 | 3 | 41 | 159 | 19.02 |
| Bunting Gallo 2017 | 532 | 102 | 0 | 0 | 250 | 0 | 0 | 0 | 180 | 38.16 |
We’ve taken away all of his 41 home runs, but we’ve also replaced 73 of his outs with singles. Those bits of value add up quickly. In fact, we see that the .470/.470/.470 hitter we hope Gallo would be by bunting against the shift is twice as productive as the real Gallo was in 2017. Even if we assume that Gallo is actually a below-average bunter and might not be able to get it right 47 percent of the time, he’s still better off bunting.
But OK, maybe there’s something to the idea that a hitter who was this devoted to singles is something well outside the norm and that our methods for placing value on it aren’t quite up to the task. Maybe in isolation, a single is worth 0.45 runs, but in the context of a lineup, Gallo slapping that many singles just isn’t worth as much. To test that, I used a lineup simulator, which essentially “plays” a baseball game as a series of dice rolls.
I simulated the Rangers’ Opening Day lineup (Delino DeShields, Gallo, Elvis Andrus, Adrian Beltre, Nomar Mazara, Shin-Soo Choo, Robinson Chirinos, Rougned Odor, Ryan Rua) and assigned them their 2017 stat lines as my baseline. I ran 100,000 simulated games for that lineup and came up with an estimated runs per game of 4.80. I then replaced the “real” Gallo with the bunting stat line above, re-ran the simulator a million times, and the computerized Rangers jumped up to 5.20 runs per game. Bunting Gallo makes a big difference.
(Note: There’s a small sleight of hand being played here. Careful readers will note that there will be situations in which the other team is not quite as extreme in its shifts. For example, when the Rangers had a runner at second base and Gallo was up, the Astros had Bregman playing toward the third base line, though off the line a good bit, so as to prevent an easy stolen base, and maybe accidentally preventing Gallo from thinking about a bunt. There will be some situations like that, but the point of the exercise is that when the left side of the infield is vacant, the numbers say over and over again that Gallo should be bunting.)
Bunting Isn’t Just for Opening Day
Consider what we’re saying here for a moment. There’s room for Gallo to be right that bunting is hard. There’s room for Gallo to be a below-average bunter. There’s room for him to fail to reach base nearly 60 percent of the time he tries to bunt. Even then, when the other team gives him that much real estate to work with, he should take it. And that’s for one of the most prodigious home run hitters in the league.
Now, someone out there is probably thinking “well, if he bunts all the time like that, eventually, teams will take it away by moving the third baseman back to the line to defend it.” That’s probably right, but there’s a silver lining in there. Teams have chosen the shifted defense because they believe a) players aren’t going to bunt, or at least not bunt enough to make them care, and b) the shifted defense that they’ve come up with is what they figure to be the best way to get you out when you swing away. If you can trick them into something that’s not the optimal defense, you’ve won.
I’m no fool. I know Gallo will probably occasionally drop one down on a whim once in a while, but probably won’t embrace wholesale bunting. Just so we’re clear, though, the numbers say that Gallo is worth more to the Rangers bunting than swinging for the fences. Yes, he’d be giving up his home run power. Yes, he’d probably make an out half the time and he’d look silly (and heaven forbid a grown man should look silly). But if he could master bunting with even some below-average modicum of success, what he would gain would be more valuable. The numbers are crystal clear on this. The only thing standing in his way is pride, though that will probably be more than enough.
Let the hashtag campaign begin. #BuntJoeyBunt
Thank you for reading
This is a free article. If you enjoyed it, consider subscribing to Baseball Prospectus. Subscriptions support ongoing public baseball research and analysis in an increasingly proprietary environment.
Subscribe now
I wonder where Bregman (or a lesser 3B) would be positioned with a guy on second, and if there is any strategy Gallo could employ to see a better defense with a RISP.
Could be fun (read: a fun headache!) to calculate values when the 3B is back vs. playing for the bunt (I realize the immense problems with the folks willing to bunt against that alignment). Might shed some light on potential success bunting against a "runner-on-second shift."
Once Gallo's intent to bunt is known, the pitcher is going to adjust accordingly. Verlander is tough enough to bunt on normally. But if it's 97 up and in or a low curveball or whatever other pitch is especially difficult to bunt well because he knows what you're doing, that makes it more difficult to make contact (which presumably also produces worse contact on average). This also fails to adjust for the pitcher's ability to make more challenging pitches to the batter as he falls behind in the count. This could have a drastic impact on the math -- or so I thought...
The math currently produces a .470 average, with the batter successfully getting a hit 24.6% of the time with 0 strikes, 14.2% of the time with 1 strike, and 8.2% of the time with 2 strikes (.246+.142+.082=.470)
However, for the sake of illustration, let's adjust the fair contact rate on the first attempt up from 42.3% to 50% and the conditional hit success rate from 58.2% to 65%. However, on the subsequent attempts, let's go down from 42.3% to 35% and from 58.2% to 50%. Now the average drops from .470 to .469 (.325+.088+.057). But what if it's a more extreme effect? Let's try 30% and 40%. Now it drops from .470 to .427 (.325+.060+.042).
But what if Gallo is a notably poor bunter and we drop his fair contact rates down 5% points across the board after the extreme order effects (45% & 25% respectively)? Now that .470 average becomes a .389 average (.293+.055+.041).
I was ready to say that Russell's conclusion was being a bit too aggressive with his "crystal clear". But I'm pretty convinced. Even if there's an unaccounted for advantage to the pitcher in the math presented in the article, the batter would have to be an incredibly poor bunter to not put up a very, very respectable wOBA by bunting against the shift.
While it would be interesting to analyze signaled bunts vs. surprise bunts separately, I'm not sure it matters all that much.