
The value provided by draft picks is a contentious point, driven by the latent nature of returns from most picks. The overwhelming majority of draft picks don’t even reach the big leagues. This is fairly intuitive when 40 rounds worth of players are selected. However, many picks from high rounds fail to make it as well.
Of the draft picks who actually do make the major leagues, the valuation issue still remains. Though a small group spend a very short time in the minor leagues and an even a tinier minority, like John Olerud, go straight from amateur baseball to the majors, the overwhelming majority of players spend significant time in the minors. That fact often muddies the value perception of picks.
When Victor Wang (then of The Hardball Times, now of the Cleveland Indians) published his analysis on this subject in 2009, it introduced a process to attach a true dollar value to draft picks. It changed the way we view draft picks as assets to teams. On top of that, his original work spawned a flurry of similar offshoot projects.
When the work was written, free agent compensation was completely different under the seemingly ancient Type A/B system. Wang also used an outdated valuation metric called WSAB, or Win Shares Above Bench. Wang’s work was done nearly a decade ago, and the underlying mechanisms of the draft have changed multiple times since. As a result, a new analysis of draft pick valuation that reflects a modern approach to assessing overall player value is warranted.
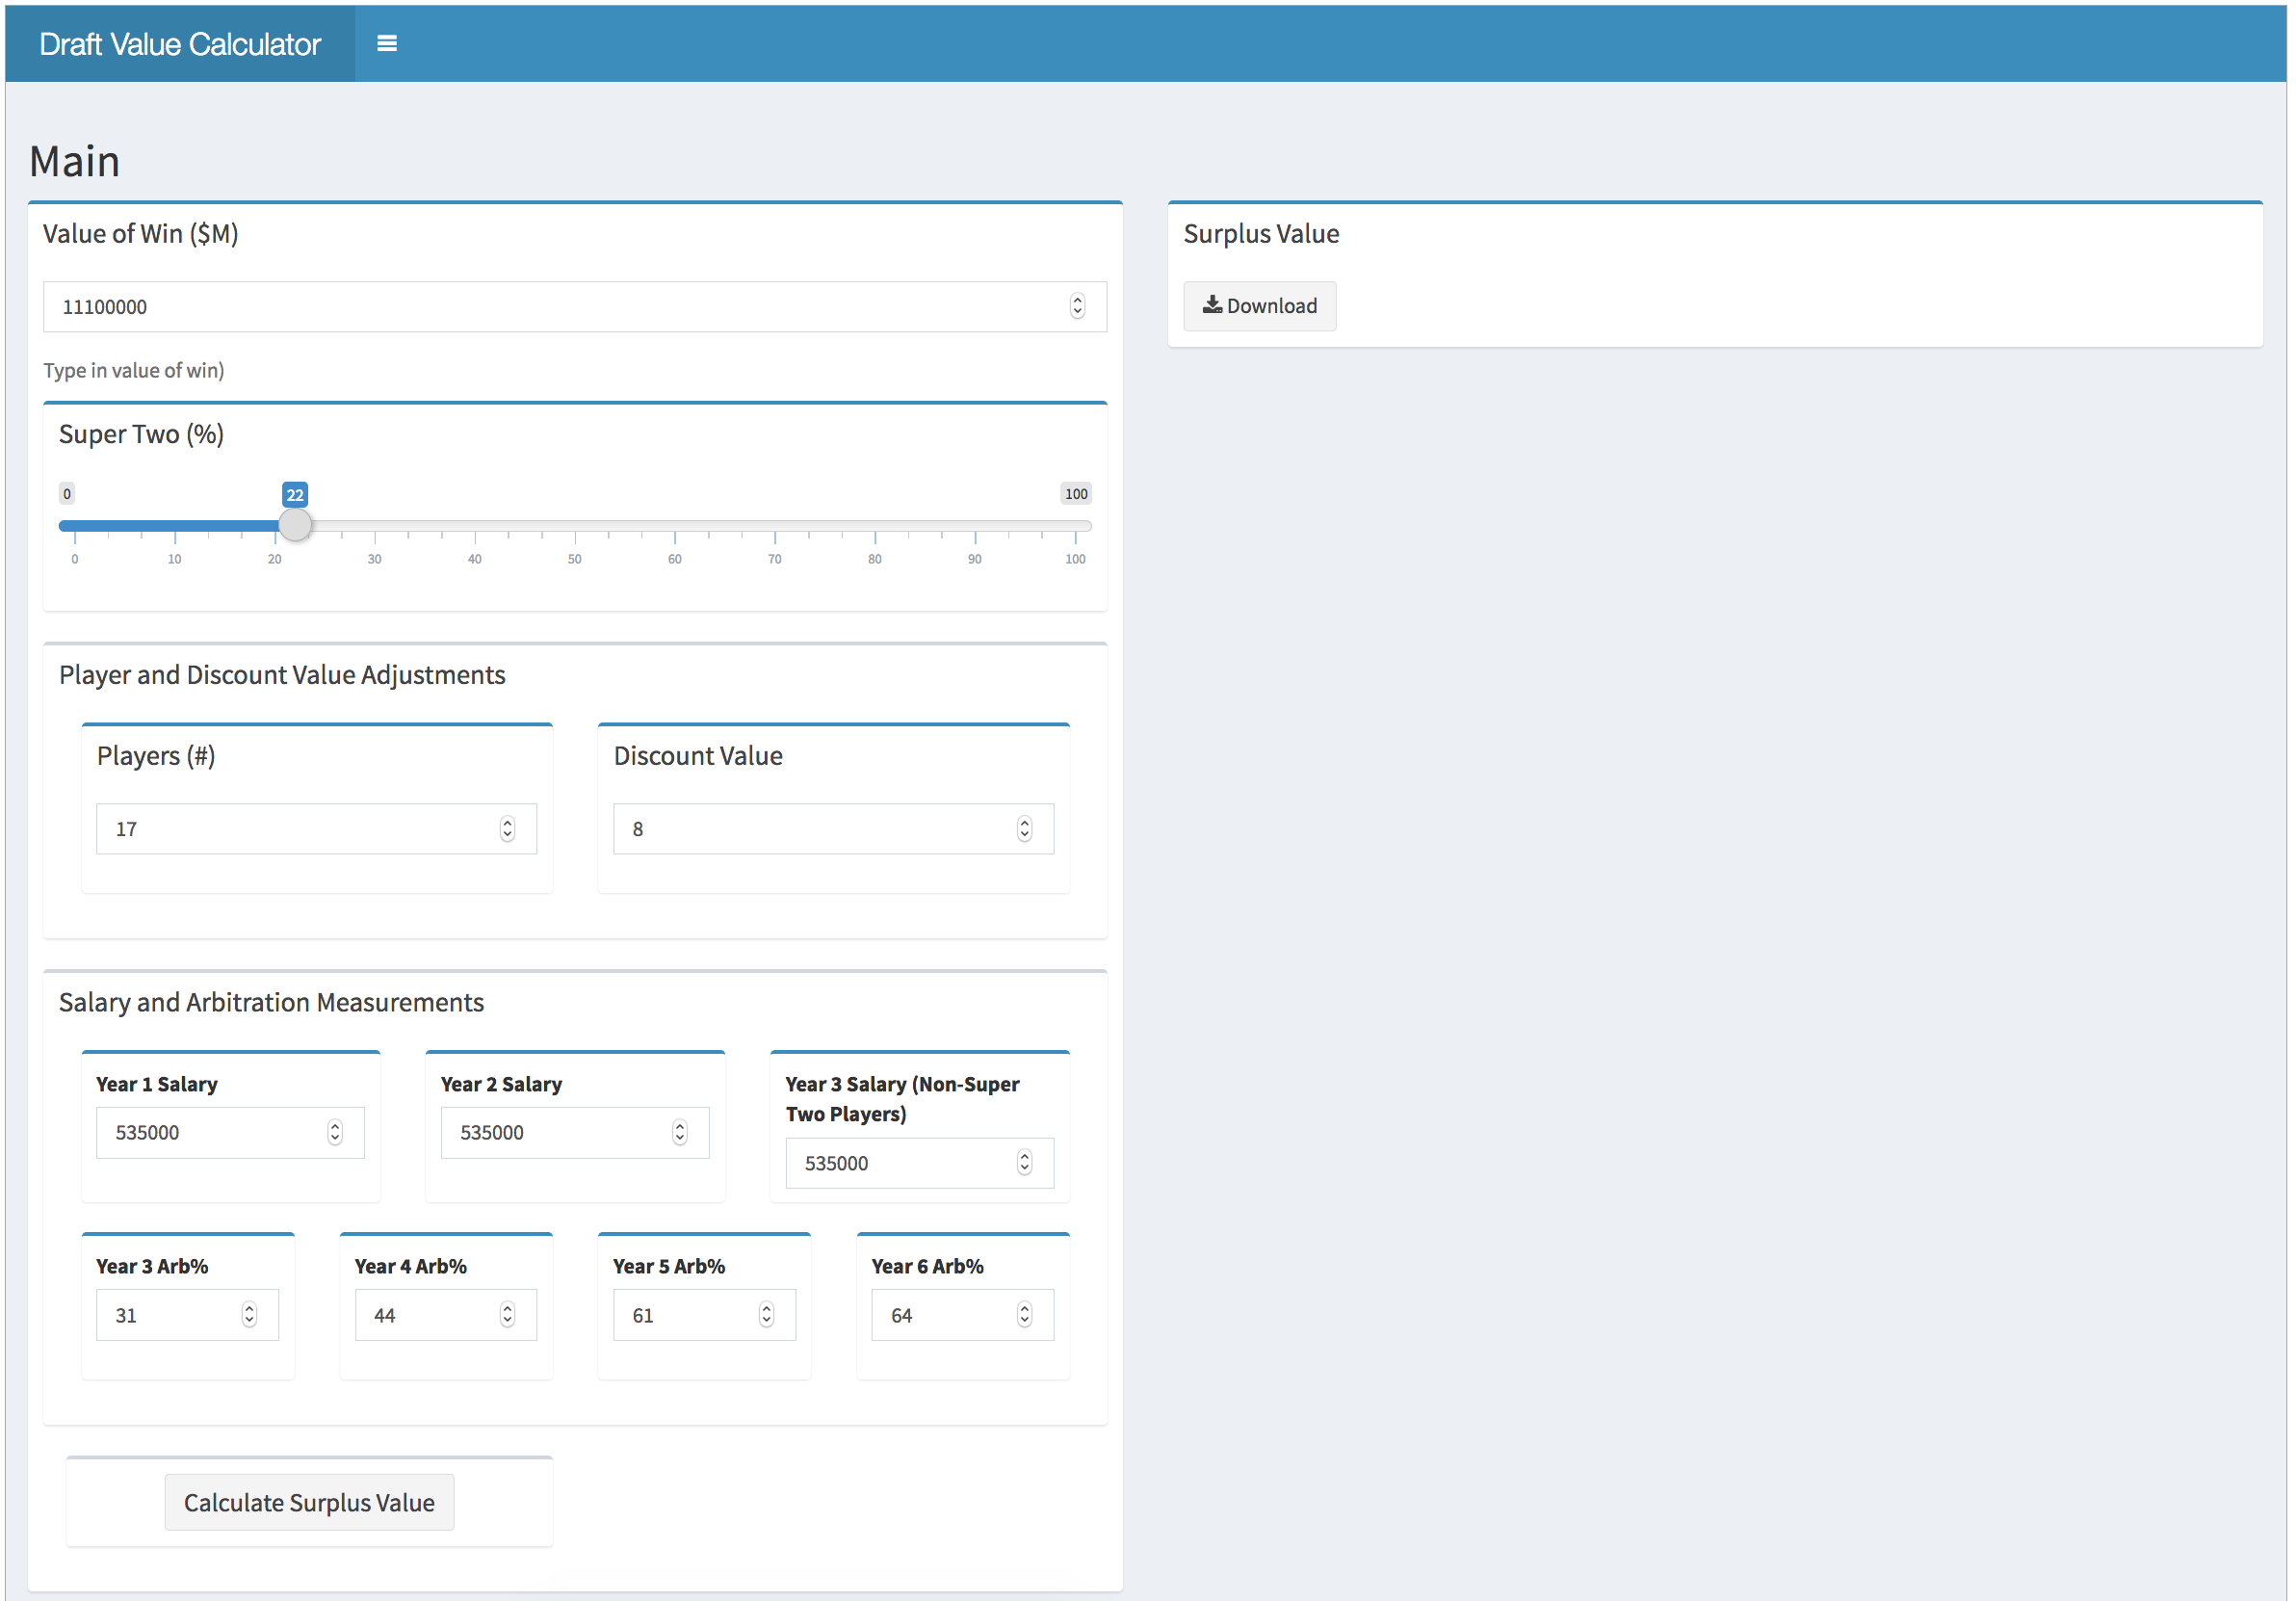
Taking this mindset, we’ve created a Draft Value Calculator that provides the user with all avenues of customization to fit their research goals. Essentially, our tool delivers the cleaned, compiled data to the user and uses their chosen inputs to arrive at a surplus value.
Data
For this project, we primarily relied on Baseball Prospectus’ MySQL database. The major repositories of batter, pitcher, and draft data became the sources of our analysis. Using those tables, we were able to filter down to the correct degree of depth and select the picks, players, and seasons we wanted to query. For the default values in the Draft Value Calculator, we deferred to a few different sources.
First, a few things were gathered from the Collective Bargaining Agreement. The Super Two percentage determines how many players enter arbitration between their second and third years of major-league service time. Since the last CBA agreement, that number was set at the top 22 percent of players based on service time. Along with Super Two, the latest minimum salary was used for the salary of year one, year two, and non-super two players in year three.
Second, the dollar value of a win statistic was sourced from Matt Swartz’s study that was published on FanGraphs in 2017. Though we took a stab at developing this ourselves, the overall process deserves more attention on its own. Even in using our flawed methodology, our conclusion was only marginally different from Swartz’s, so it seemed more prudent to use the methodology with the established credibility.
Finally, we used Nate Silver’s projections on salary arbitration for the default arbitration modifiers for years three, four, five, and six. The modifier for year three would apply to the number of players who qualify for Super Two status. However, years four, five, and six would directly apply the arbitration modifiers to all players.
Methodology
The analysis takes the first 80 selections from each year of the draft from 1996 until the present. The picks were chosen based on the range of picks that were affected by the previous qualifying offer system, which went as deep as pick no. 78. From there, we filtered out all of the players who failed to sign or make the major leagues.
Using the qualifying players, we broke out their careers by season. From there, it was a matter of excluding seasons past team control. For the sake of simplicity and consistency, we placed this through the sixth season the player appeared in the majors. This constraint was because of the lack of consistency in major-league service time data beyond 2006. After that, the players were aggregated into groups based on their overall pick and season. For example, all players in season two who were selected fifth overall are in a group together.
After the picks and seasons were binned, their performance could be put into a present value context. In order to do that, the total WARP for each season grouping must be discounted appropriately. To do so, the total WARP is multiplied by a discount factor. The default discount rate is set at eight percent, which is generally standard for this type of analysis. So, at a rate of eight percent, the discount factor in the third year would be (1-0.08)^2.
Here’s an example using Rocco Baldelli and approximately an eight percent discount rate:
| Year | WARP | Discount | Discounted WARP |
| Year 1 | 4.12 | 1.00 | 4.12 |
| Year 2 | 3.30 | 0.92 | 3.04 |
| Year 3 | 2.62 | 0.85 | 2.22 |
| Year 4 | 0.04 | 0.78 | 0.03 |
| Year 5 | 0.12 | 0.72 | 0.09 |
| Year 6 | 0.46 | 0.66 | 0.30 |
This process introduces risk and the time value of money to the equation. It’s essentially saying that performance further from the first year of big-league action is less reliably predicted and less valuable because it is not immediately available.
After that, we would need to be able to correctly value a win. As we said previously, we deferred to Swartz’s win valuation and settled on about $11 million. Moreover, this number would be used in calculating a “deserved” salary as well as our salary projection for the player in that season.
Finally, we would need to project out earnings for the players in the sample. For this we made a few assumptions. First, the player would be paid a minimum salary for their first, second, and, for some, third seasons. This is generally true for a player’s first season, but teams have the option to raise their salary beyond that prior to arbitration. This isn’t necessarily always the case, even with premium young players like Carlos Correa.
After the total salary differential was calculated, we binned them into total groupings and moved toward calculating surplus value. In order to calculate the surplus value, we first needed to subtract the expected salary from the deserved salary. This would return a total surplus for the pick. In order to get it to the individual level, it has to be divided by the number of drafts in the sample, which takes the total number of drafts from 1996 onward and subtracts the median number of years it takes for those players to reach the majors.
Results
The process produced some interesting results. First off, the pick values are much higher than Wang’s. This is driven by the change from WSAB to WARP and the increase in the value of a win. The baseline of the statistic is much lower, which is due to WSAB being pegged to a bench player. Thus, WARP gives us a wide base of value from which to pull. As far as the value of a win, there was a much different valuation before Swartz’s analysis was published. Dave Cameron had previously come up with valuations around $4 million at the time Wang’s analysis was published. Wang doesn’t explicitly cite his valuation, but it seems likely that it is something of that nature.
On a pick-by-pick level, the data can be interpreted in a couple of ways. The simplest way would to be to break them up into how they’ll be applied, either historically or to project. Currently, the Draft Value Calculator outputs with surplus values tied to their historical results at each pick. This output shows a fair amount of variance, but also an asymptotic trend that would be accompany this type of data.
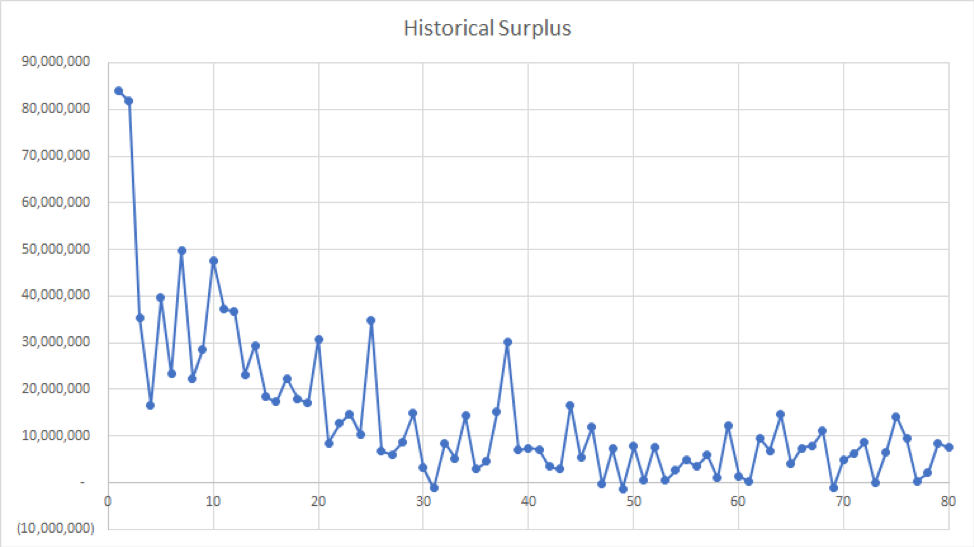
A historical interpretation can be used to look back at drafts to see how efficiently they used their draft capital and maximized returns with their picks or alternative ways of using them.
In cases where the user is looking forward, the data must be presented differently. Theoretically, each successive pick should have the maximum amount of non-selected surplus value available to it. For example, when someone is looking to apply a draft forecasting model and tie in surplus valuations to each pick, they would use this approach. Thus, a rough smoothing is necessary to present the data.
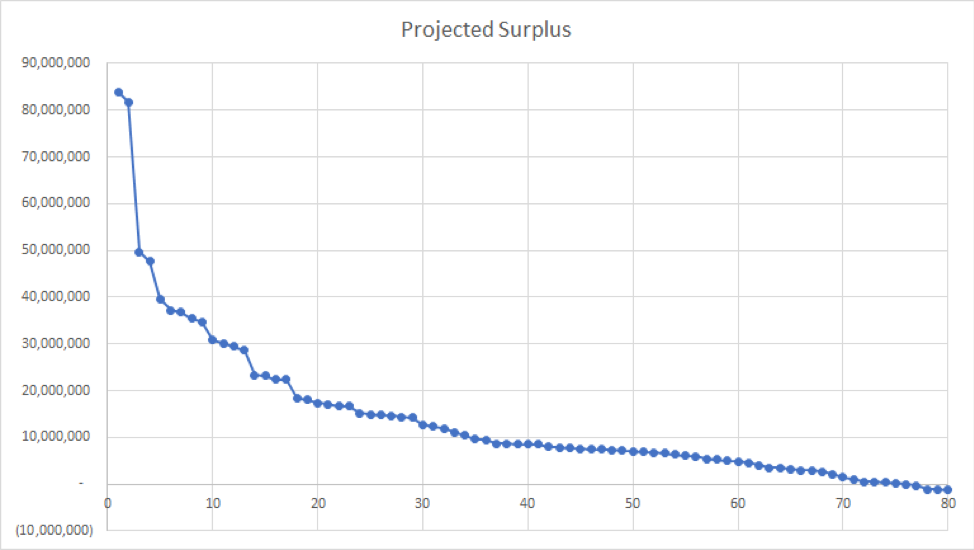
The smoothed data shows the asymptotic nature of the data. There are a few points early in the draft where the surplus value takes a noticeable drop. All in all, this shows a very clear picture of what’s available along the way for teams to select at each pick.
Challenges/Further Research
This project lays a foundation to build upon when it comes to draft pick valuations in the modern era.
The major improvements with this project lie in salary and service time. Precision with total WARP accrued up until free agency is not simply a matter of a player’s first season appearance through their sixth. It could be possible that a not-insignificant amount of WARP was left out because of this service time shortfall. We can more precisely measure this through 2006, but the data drops off from there. In terms of salary, further refinement with average salary in years two and three provide a very clear point of improvement. On top of that, Silver’s arbitration modifiers are likely overdue for some re-calibration.
In terms of advancing the research, there are several avenues to take. Major offshoots from Wang’s original analysis, like prospect valuation, are potential next steps. However, as we move past the previous qualifying-offer era, a holistic evaluation of the transactions made in that era seem like a fantastic point of interest as well.
Thank you for reading
This is a free article. If you enjoyed it, consider subscribing to Baseball Prospectus. Subscriptions support ongoing public baseball research and analysis in an increasingly proprietary environment.
Subscribe now