Each winter, as baseball hibernates and dreams of the joys that await, PECOTA goes through a multi-layer process that begins with locating similarities between players past and present, and using the past trajectories to inform its expectations for the upcoming season. While the system proceeds to combine those expectations into predictions for teams and standings, today we’re stopping at the player level where it assigns each one a “breakout” rate for 2018.
A product of those comparable players, “breakout” rate represents the chance the hitter or pitcher in question will improve his rate of production by 20 percent or more. For hitters, it’s measured by BP’s True Average (TAv) metric. Established, aging, or otherwise unfathomably plateaued talents can receive zero percent breakout rates. More than 170 hitters got the goose egg for 2018.
Count this, then, as yet another reason to love PECOTA: Mike Trout was assigned a one percent chance of breaking out, which we’ve established is more than a mathematical default. It is PECOTA staring down Trout’s stupendous, all-time, inner-circle career to this point, asking if it could possibly ascend to a different plane, and then busting out its best Dumb and Dumber meme.
So, yes, PECOTA is saying there’s a chance–a chance that Trout is about to unleash one of the best offensive seasons in baseball history.
***
Before you ask: The exact breakout rate is admittedly less than one percent–0.88 percent, rounded up. And deep in the PECOTA machine, its origins can be traced to, er, Matt Kemp.
Finding same-age comparable players for Trout is difficult. A good chunk of the 100 most similar players to present-day Trout, captured in single-season snapshots, are simply worse than he’s ever been, worse than his 10th-percentile projection. Kemp is one of them. His 2010 season, a dip for him at the time, was vaguely analogous to Trout’s 2017 because of the contours of their production. The Kemp “breakout” in 2011 was indeed a huge leap forward. It also has the advantage of registering as a plausible Trout season. Kemp’s 2011 TAv would rank third-best within Trout’s career thus far.
Trout is not coming off a down year. An injury-interrupted one, sure, but one in which he recorded career-bests in (deep breath) …
- On-base percentage (.442)
- Slugging percentage (.629)
- Walk rate (18.5 percent)
- Strikeout rate (17.8 percent)
His TAv landed at .360–second-best to his dominant 2013 in a more difficult run-scoring environment. More than the specific occurrence of Kemp’s ascendance, then, PECOTA is recognizing the capacity of 26-year-old baseball players to get better, and in some cases much better. The two closest comps for Trout’s upcoming age-26 season, by PECOTA’s estimation, are Mickey Mantle’s 1958 season and Frank Thomas’ 1994 season.
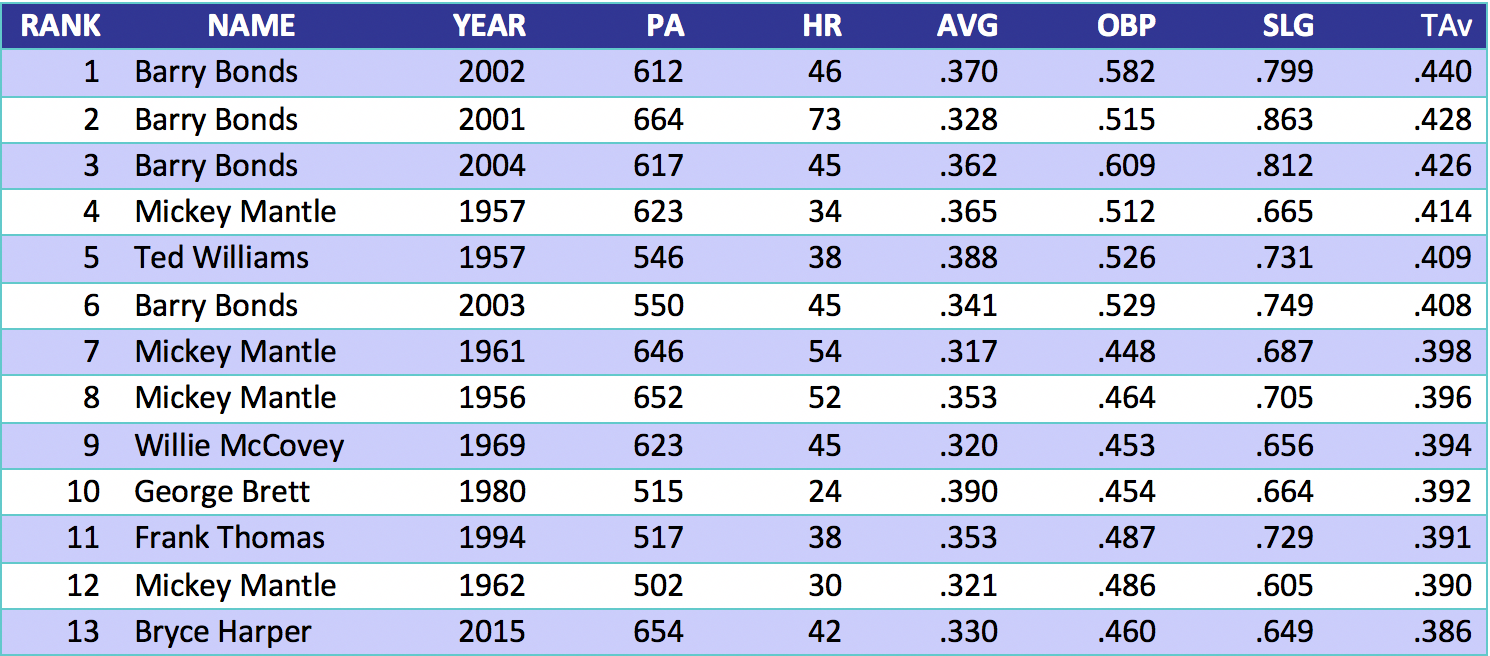
To reach that flickering “breakout” star we see in PECOTA’s telescope of hypotheticals, Trout would have to vault his TAv up to .432–ahead of Barry Bonds’ 73-homer 2001 season, and behind Bonds’ 2002 season that featured a .582 OBP. He would have to post the second-most-productive offensive season on record by TAv (which covers the integration era, essentially).
Daunting as that sounds, who are we to cower in the face of unlikelihood? To begin envisioning this wondrous season, we need to first understand some basic concepts behind TAv. It is adjusted for era, and factors in some aspects of a hitter’s performance–like avoiding double plays, or the quality of opponents faced–that don’t manifest themselves in a triple-slash line. Therefore, constructing this greatness is not as simple as assembling the rates at which Trout must hit, reach base, and accumulate extra bases.
What we can do is examine the extremely limited history of seasons that reached this feverish level of production.
This is probably going to require a .500 OBP. That much is clear.
The requisite slugging percentage is more complicated to pin down for several reasons. For one, while we know home run totals–and thus slugging percentages–have surged lately, we can’t be positive it will continue apace. His power output is also inextricably linked to that OBP. You don’t need many case studies (2015 Bryce Harper and any peak Bonds year will do) to understand the dynamic: Pulverizing everyone will force them to change their approach.
In the end, though, there will have to be that combination of three numbers, destined to morph into one distinct, all-encompassing thing, like a phone number or pin code. So, for the sake of this exercise, Trout’s breakout season would become remembered as such: .354/.502/.717.
For the record, there’s no way to be sure this would even cross the threshold for a “breakout.” Doing it against weaker competition could nick the TAv. An even more offense-friendly shift in the league scoring environment could have the same effect. But it’s sufficiently extreme to fit with the other seasons in that stratosphere, and the makings of it are, incredibly, within the loosely defined bounds of reason.
Follow along, if you will. The line is based on a season of 705 plate appearances, a bit above Trout’s usual full-season total since a team featuring this performance would likely score quite a bit.
We’ll start with his strikeout rate progression: It dropped from 23.2 percent in 2015 to 20.1 percent in 2016, then further to 17.8 percent in 2017. He would lop some more Ks off in a breakout season, down to 14 percent. His walk rate, meanwhile, would jump up to 21.7 percent. It’s been on the rise since 2015. From 11.8 percent to 18.5 percent in 2017. His chase rate, for what it’s worth, was already fifth-lowest in baseball last year, at 19.1 percent.
Last year was actually the first time Trout walked more often than he struck out. Mantle, for instance, hovered right at that inflection point for a couple seasons–as Trout has. And in Mantle’s best offensive season, 1957, he suddenly walked 23.4 percent of the time and struck out only 12 percent of the time. In 2015, Harper’s walk rate skyrocketed almost seven percentage points. And, to reiterate, Trout would be in the midst of a better year with the bat.
We’re also factoring in 11 hit by pitches, commensurate with Trout’s typical total, and four sacrifice flies.
That means he’ll have 537 at-bats. While the time he missed in 2017 obscured it a bit, Trout took a major step forward in the power department, cranking a homer in 6.5 percent of his plate appearances. In an attempt to stay realistic (don’t give me that look), we’ll ratchet that up only slightly, keeping it below seven percent. That puts 49 homers in our hit bucket.
Next, we have to pause and consider the sequencing of how these gains would be made. The ideal orchestration of this delirious dream season might involve some sort of well-publicized on-base streak and a typical Trout-ian homer pace early on, followed by a second half spent feasting on walks and awful attempts to steal strikes. We’re expecting the benefits to flow from staying ahead of terrified pitchers, pouncing on every good pitch. We are also generally expecting that pitchers won’t abandon ship.
Intentional walks have not been eradicated by any means, but they have fallen out of favor enough, and with enough teams, that it seems unlikely a Bonds-style malaise would befall this type of season in 2018. With that in mind, let’s put him down for 38 doubles, one shy of the career-high he hit twice in his peak speed days. And we’ll throw in five triples, matching his 2016 total.
As for the rest of the hits, what we really have to pinpoint is a BABIP. Last year, it was a career-low .318. There are many reasons to think his true skill in this arena could be in decline—a lesser emphasis on speed in his game, an uptick in fly balls as needed to hit for power, etc. It’s worth noting that Bonds’ speed, as judged by stolen bases and defensive prowess, was also showing signs of erosion by the time he put up his first Bonds Season in 1992.
Plus, Trout went heavy on the fly balls. There’s room to bring his line-drive rate up plenty without reaching career-high levels. His career BABIP (this is going to look like a joke, but it is not) currently sits at .355. We’re just giving him a little bump to .359, by adding in 98 singles and bringing the hit total to 190.
Suddenly, having only taken him above his demonstrated capabilities in power and the often-connected plate discipline skills, we’ve arrived: .354/.502/.717, 49 homers, black ink everywhere.
***
This sounds like a farce, a lark for a cold February evening. It is that.
It is also a math problem very easily solved–mostly with parts already lying around in Trout’s superhuman baseball toolkit. With comparable problems of yore as proof that a solution can be reached.
Once the absurdist shock of the numbers fades, you can juxtapose the necessary events with actual events and feel as though this whole thing is not only within the realm of possibility but almost foreseeable. Could Trout be 13 hits–a couple homers, a couple doubles–better than Harper’s 2015? I don’t know, isn’t he 13 hits better than Harper most years? Could he be 1994 Frank Thomas, just with some wilder, more angsty pitchers who plunk him nine extra times? I mean … sure?
Mike Trout breaks out.
It’s unfathomable. It’s within arm’s reach. It’s both, and if we got to play the season on loop over and over again like a video game, 12-year-old you would make it happen before dinner.
Thanks to Rob McQuown for research assistance.
Thank you for reading
This is a free article. If you enjoyed it, consider subscribing to Baseball Prospectus. Subscriptions support ongoing public baseball research and analysis in an increasingly proprietary environment.
Subscribe now