Baseball Prospectus first published PECOTA projections for players and teams in 2003. In the ensuing 15 seasons, through last year, we projected that the Detroit Tigers would win 1,200 games, or an average of 80 per season. The Tigers, since 2003, have in fact won 1,200 games, or an average of 80 per season. Good job, PECOTA!
Of course, PECOTA doesn’t always nail it. And when it doesn’t, we often hear from fans of teams, asking whether somebody has a thumb on the scale, tilting PECOTA in favor of or against certain teams.
Here is the difference in wins projected by PECOTA and actual wins for all 30 teams during the past 15 seasons. A positive number indicates that PECOTA was overly optimistic, a negative number means it was overly pessimistic.
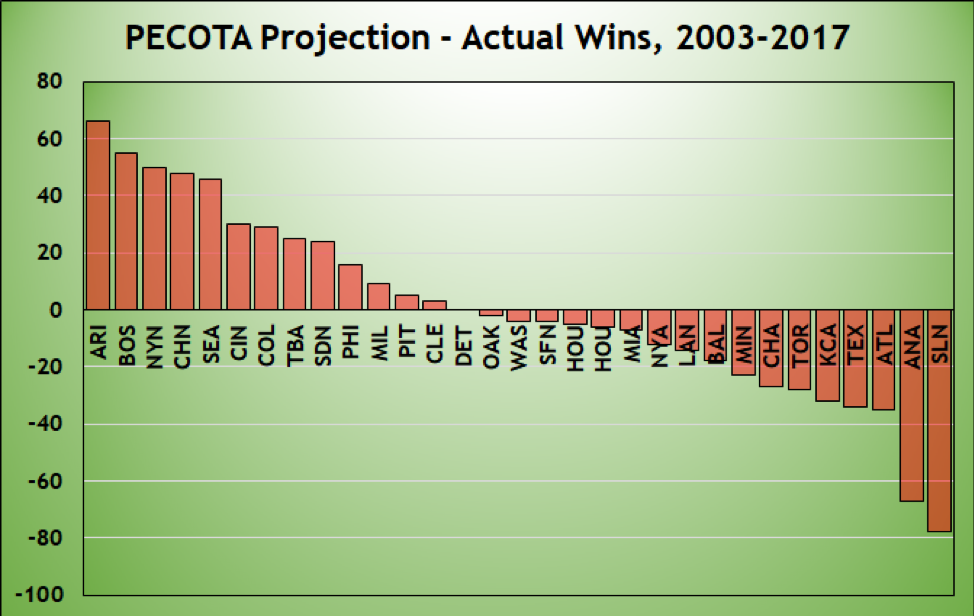
PECOTA sure loves those Diamondbacks, huh? Well, not exactly. In 2003, Arizona went 84-78. The next season, PECOTA expected an 81-81 record. That’s reasonable, right? Instead, they completely collapsed, to 51-111. Similarly, in 2008, after Arizona went 82-80 with young stars Justin Upton and Stephen Drew and a pitching staff led by Dan Haren and Brandon Webb, PECOTA expected a 92-70 team in 2009. Maybe that was optimistic, but the team instead tumbled to a 70-92 record, costing manager Bob Melvin his job. PECOTA expected a partial rebound, to 85-77 in 2010. Instead, they sunk further, to 65-97, costing manager A.J. Hinch his job.
The point is, while PECOTA has projected 66 more wins for Arizona than the team actually achieved, three big misses accounted for over 100 percent of that difference. In the other 12 years, PECOTA was, on net, pretty close, predicting six fewer wins than the team accumulated. PECOTA was too pessimistic in five years, too optimistic in seven. In other words, it was pretty close.
So, raw totals don’t tell us that much. One bad year—show me the projection system that didn’t way overshoot the win totals for the Giants and Mets last year, and I’ll show you somebody who fudged the data—can skew the results. We can’t tell which teams PECOTA hates or loves this way.
Additionally, PECOTA has been updated several times. Teams have changed a lot as well. I don’t think anybody seriously thinks there’s a line of code that says IF BAL THEN FINAL_WINS = PROJECTED_WINS – 10. (Well, some people might. But trust me, there really isn’t such a line.) But maybe certain types of teams tend to be underrated or overrated by PECOTA. In recent years, PECOTA’s been accused of being overly fond of the Rays and overly dismissive of the Royals, for example.
So let’s look just at recent years. Instead of the whole 15-year PECOTA lifespan, I’m going to concentrate on the last half-dozen years. I listed all teams for which PECOTA was wrong in one direction or the other five or more times. If we figure the odds are 50/50 that PECOTA will be high or low, the odds of PECOTA overshooting four times and undershooting twice are about 23 percent. That’s not very unusual. Going high or low five or six times, though, that’s only an 11 percent probability. Maybe there’s something going on.
I also wanted to see the magnitude of the error. If PECOTA thought a team would do worse than it actually did, but the difference was only a game or two, that’s not a big deal. To avoid getting thrown off by one big outlier, I took the median difference of the misses.
Here are the teams that PECOTA arguably “loves”:
| Team | Times Too High | Median | Years |
| Phillies | 5 | 7 | 2012 (8), 2013 (7), 2014 (4), 2015 (6), 2017 (8) |
| White Sox | 5 | 6 | 2013 (14), 2014 (2), 2015 (2), 2016 (7), 2017 (9) |
| Reds | 5 | 6 | 2013 (2), 2014 (7), 2015 (15), 2016 (6), 2017 (6) |
It’s not that hard to understand PECOTA’s ardor. The Phillies had won five straight divisional titles heading into the 2012 season; PECOTA reasonably didn’t expect the collapse we got instead. The White Sox always had a core of good players—Chris Sale, Jose Quintana, Adam Eaton, Todd Frazier, Jose Abreu—but didn’t build a supporting cast around them and then held a firesale. As for the Reds, they had (by runs per game) the league’s third-worst offense in 2014 and a bottom-four pitching staff each of the past three years. PECOTA didn’t think things would be that bad.
And here are the teams that PECOTA arguably “hates”:
| Team | Times Too Low | Median | Years |
| Orioles | 6 | 12.5 | 2012 (21), 2013 (11), 2014 (18), 2015 (3), 2016 (14), 2017 (1) |
| Royals | 5 | 10 | 2013 (10), 2014 (11), 2015 (23), 2016 (6), 2017 (8) |
| Cardinals | 5 | 6 | 2013 (13), 2014 (2), 2015 (12), 2016 (5), 2017 (6) |
OK, Baltimore and Missouri, we hear you.
Here’s the thing, though: These are three idiosyncratic teams.
- The Orioles have had, for years, a low-OBP, homer-dependent offense and a weak starting rotation backed up by a great bullpen. After six straight years of 70 or fewer wins, they won 93 games with an 82-80 Pythagorean record in 2012. Since then, they’ve had a starting pitcher ERA meaningfully better than the league average only once, and had a below-average OBP every year …
- … which is similar to the Royals, who had a below-average offense in four of the five seasons (all but 2015) that PECOTA aimed low. And, like the Orioles, they’ve had a rotation that doesn’t inspire confidence. And, like the O’s, they’ve had shutdown bullpens.
- And then there’s Cardinals Devil Magic. Aledmys Diaz. Paul DeJong. Tommy Pham. Jedd Gyorko. Peak Jason Heyward and Jhonny Peralta. The 2013 team that batted .330 with runners in scoring position, the best such performance since 1930. Every year, it seems, the Cardinals turn some middling prospect into gold, or get a career-year out of an unremarkable veteran. The team’s had admirable depth, but a bottom-up projection system like PECOTA captures that. What it doesn’t capture is players who perform far above their expectation. Every. Single. Year.
(Another possible reason for consistently outperforming projections is management. Baltimore’s Buck Showalter is widely regarded as one of the game’s cleverest skippers. Those who wish to debate the merits of Ned Yost and Mike Matheny in the comments section, please keep in mind that this is nominally a family site.)
Take heart, Baltimore and Missouri baseball fans. PECOTA, like every projection system, has its faults. PECOTA’s seeming blind spot is the way your teams have taken, shall we say, an unconventional route to their success. If it were the Rangers who were winning all the time despite a low OBP and a shaky rotation, or the Astros whose farm system kept producing better-than-expected players, we’d be hearing about an anti-Texas bias. It’s the way your team plays, not the club itself.
Now, about your favorite band …
Thanks to Alex Crisafulli for research assistance.
To celebrate the launch of the 2018 PECOTA projections, we’re offering 18% off new subscriptions and extensions of existing subscriptions. To take advantage of the limited-time offer, pick a subscription and enter the discount code “PECOTA18” at checkout.
Thank you for reading
This is a free article. If you enjoyed it, consider subscribing to Baseball Prospectus. Subscriptions support ongoing public baseball research and analysis in an increasingly proprietary environment.
Subscribe now
By the same token, one might argue (as the article hints) that it's a good reflection on the field staff and front office if a team out-performs its Pecota projection; it says PT was adjusted properly, or acquisitions made, to address weaknesses that became clear as the season wore on. That might be better spin than simply that the model is off!