While there is no shortage of metrics that purport to describe how “good” or “bad” a pitcher really is, there has been less focus on metrics that describe how a pitcher gets to their results. This, then, is the goal of the metrics introduced here: To provide as comprehensive a picture of a pitcher as possible, to be used as quantitative illustrations with their results.
We are happy to introduce three new “top line” pitching metrics. These metrics are rated on a scale of 0-100 across all seasons in the sample, so the top Power Score season of all time would be 100, while the lowest Power Score of all time would be 0. These stats can be found on our new Advanced Rates stat report.
Power Score
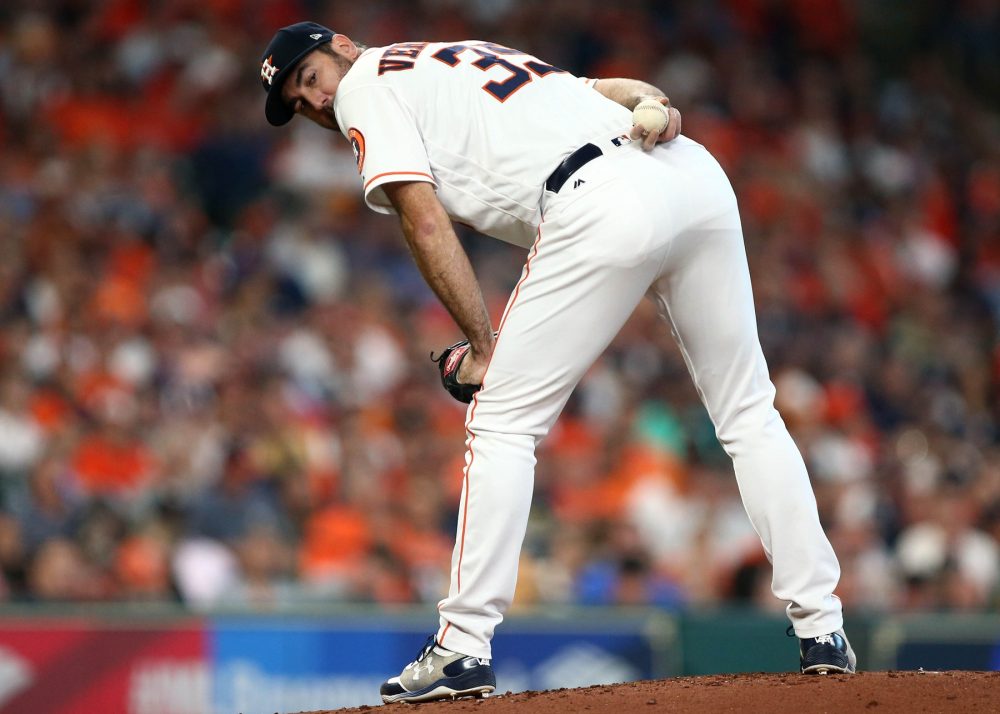
What is a “power pitcher”? We hear the term a lot, usually in reference to someone like Justin Verlander, but it’s never been an exact term. As part of developing a new suite of pitching metrics and diving deeper into the ways in which break down the art of throwing a ball very hard, we’re taking a look at “power pitching” and quantifying exactly what it means to be a “power pitcher.”
Luckily for us, the pieces to measure whether or not someone is quantifiably a “power pitcher” already exist, it’s just a matter of deciding how best to put them together. Clearly, velocity is a large part of the equation, as the “power” part of the description, and we weight peak fastball velocity the heaviest when constructing these rankings.
Power pitchers use their fastballs a lot, as well, as it tends to be their highest-graded pitch, and the one they feel most comfortable leaning on in stressful situations. Other determining factors include median offspeed velocity—power pitchers tend to rely on harder offspeed pitches, so sliders over curveballs. The classic example here is all-time power starter Justin Verlander, with his hard, biting power slider. This also points to the fact that the power pitcher isn’t relying on pitch velocity differential, but on something closer to pure velocity. Differential and deception are obviously useful components, but for the power pitcher, they’re of less concern.
As of right now, our Power Score is comprised of these three identifiable parts: Fastball velocity (three parts), fastball percentage (two parts), and the velocity of all offspeed pitches (one part). There are some other factors that we considered when developing this metric—such as the tendency to work up in the zone, and to lean on fastballs in put-away counts—but the current version of this metric only includes the three main components discussed above.
The top 10 pitchers in 2017 for Power Score were:
| Pitcher | Power Score |
| Aroldis Chapman | 92 |
| Enny Romero | 84 |
| Joe Kelly | 79 |
| Tommy Kahnle | 78 |
| Edwin Diaz | 78 |
| Kelvin Herrera | 78 |
| Craig Kimbrel | 78 |
| Pedro Baez | 77 |
| Scott Alexander | 76 |
| Blake Treinen | 76 |
Not surprisingly, all 10 of those pitchers were primarily relievers. The top 10 starting pitchers (minimum 150 innings) in 2017 for Power Score were:
| Pitcher | Power Score |
| Chad Kuhl | 68 |
| Michael Fulmer | 66 |
| Gerrit Cole | 65 |
| Luis Severino | 65 |
| Mike Foltynewicz | 63 |
| Kevin Gausman | 63 |
| Carlos Martinez | 63 |
| Lance Lynn | 63 |
| Jacob deGrom | 61 |
| Justin Verlander | 61 |
Command Score
One of the most challenging aspects of pitching to quantify, command indicates that a pitcher can throw the ball where he intends to. Our Command Score builds on Called Strikes Above Average (CSAA), which is the pitcher’s component of our framing model. In order to build on that we’ve identified target points in each corner of the zone using the likelihood of a pitch to be called a strike, and quantify the pitcher’s ability to hit that spot consistently. Pitchers are penalized for missing spots by a significant amount—either getting too much of the plate or missing off of it—to highlight their ability to effectively work the edges of the zone.
Command Score provides a new heuristic for understanding the ability of a pitcher to command his pitches. It is a composite statistic the includes CSAA in addition to other factors that we believe reflect a pitcher’s ability to command their pitches.
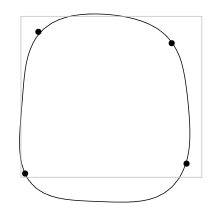
In addition to generally being able to steal strikes, we’ve broken down the strike zone into quadrants that highlight a pitcher’s ability to miss the most dangerous part of the zone. These quadrants are mapped against Called Strike Probability (CSProb) contours to identify the ideal target in each section of the zone.

Using CSProb we can identify an appropriate target area in each quadrant and assess a pitcher’s ability to hit that target with a pitch. Every pitch is mapped to the nearest quadrant and the pitcher is penalized based on how much they miss that target. Pitches that miss the target toward the middle of the zone are penalized at a lower rate than those that miss outside the zone because, generally speaking, strikes are better than balls. Of course, we’d be remiss if we didn’t acknowledge that pitches catching too much of the zone often are hit for home runs, but pitchers with better command typically throw more strikes than those without.
Once all pitches are aggregated, each pitcher is compared to his peers to identify their relative ability to command their pitches. We recognize there are myriad additional elements to command, but we’ve found this version to provide a meaningful guide into the command skill, and perhaps style, of pitchers.
The top 10 pitchers in 2017 for Command Score were:
| Pitcher | Command Score |
| Darren O’Day | 86 |
| Yusmeiro Petit | 82 |
| Kendall Graveman | 77 |
| Kyle Hendricks | 76 |
| Pat Neshek | 76 |
| Dallas Keuchel | 74 |
| Matt Belisle | 73 |
| Zach Davies | 73 |
| Jesse Chavez | 73 |
| Bartolo Colon | 73 |
Stamina Score
As with all of these metrics, our measure of stamina, alone, has nothing to do with how “good” or “bad” a pitcher is—it is simply an objective measurement of how much of a workload any pitcher is capable of carrying. Since workload exists beyond Major League Baseball, we also included any of a pitcher’s regular season minor-league efforts in calculating Stamina Score.
To calculate Stamina Score, we looked at different ways of valuing days of rest, numbers of pitches, and batters faced per game. What we found most effective is a model that combined calculating the daily number of pitches thrown from a six-day moving average, with the straight average of batters faced per game against the square root of the mean of the days of rest between games.
Not every pitcher at the top of these rankings is good, as sometimes teams carry a pitcher who can throw a large number of pitches but is only really good for games that are either already out of hand or in desperate numbers of innings. However, through selection, pitchers who see worse results tend to see fewer innings at a time, and more days between innings, for relievers. Bad starters also tend to see fewer pitches per outing over time, influencing their positioning on these rankings.
This simplistic rating is sufficient for the first generation of this metric. Future editions might benefit from in-game measurements (sustaining fastball velocity deep into outings, or back-to-back games).
The top 10 pitchers in 2017 for Stamina Score were:
| Pitcher | Stamina Score |
| Justin Verlander | 86 |
| Rick Porcello | 86 |
| Chris Sale | 85 |
| Chris Archer | 84 |
| Jeff Samardzija | 83 |
| Ervin Santana | 83 |
| Gerrit Cole | 82 |
| Gio Gonzalez | 82 |
| Jacob Degrom | 82 |
| Carlos Martinez | 82 |
Thank you for reading
This is a free article. If you enjoyed it, consider subscribing to Baseball Prospectus. Subscriptions support ongoing public baseball research and analysis in an increasingly proprietary environment.
Subscribe now