Deciding when something becomes a thing can be an arduous, uncertain process. In our public baseball dialogue, there is a significant and at times important distance we must travel between a trend being notable—a happening to be remarked upon—and the point where it takes on the inertia of reality that requires a separate, more energetic occurrence to knock it off course.
The otherworldly debuts of rookie hitters reached that initial, lower threshold for me around the time Phillies slugger Rhys Hoskins took a torch to the league. Maybe an earlier occurrence, Cody Bellinger’s bonanza perhaps, raised your suspicions that “the latest Gary Sanchez” wasn’t just a cool timing quirk of the universe. Either way, the emphatic, incredible production by rookie hitters in their earliest exposure to the majors over the past few seasons is begging for some exploration, some scrutiny.
There are so many questions. Yet we start with a prerequisite: Have hitters actually been better in their first taste of the big leagues?
Here are the top performers through 400 plate appearances, from 1992-2017:
| Rank | Name | Year | TAv |
| 1 | Jose Abreu | 2014 | .341 |
| 2 | Yasiel Puig | 2013 | .338 |
| 3 | Cody Bellinger | 2017 | .336 |
| 4 | Ryan Braun | 2007 | .329 |
| 5 | Aaron Judge | 2017 | .328 |
| 6 | Aledmys Diaz | 2016 | .326 |
| 7 | Logan Morrison | 2011 | .323 |
| 8 | Corey Seager | 2016 | .321 |
| 9 | Gary Sanchez | 2017 | .321 |
| 10 | Allen Craig | 2012 | .320 |
| 11 | Pablo Sandoval | 2009 | .319 |
| 12 | Trea Turner | 2017 | .319 |
At the tip of the spear, the answer is yes. We examined the initial 200 and 400 plate appearances of every hitter to debut since 1992. By BP’s era-adjusted True Average (TAv) metric, seven of the 20 best 400-PA debuts in that span have come in the past two seasons. Jose Abreu and Yasiel Puig, pros who came to the league from Cuba, top the list.
Two of the three best 200-PA debuts have come in the past two years. Ryan Schimpf, if you can believe it, places in the top 20, and Bellinger’s earliest windmill mashing ranks 21st. Two 2015 debuts (Miguel Sano, Kyle Schwarber) are 15th and 16th on this list.
(As a housekeeping note: Players were assigned to the year in which they crossed the thresholds. Given our search for an overall trend, it doesn’t change the thrust of things, but it’s worth keeping in mind that, say, Stephen Piscotty’s excellent 400 PAs are counted for 2016 even though a majority occurred in 2015.)
Here are the top performers through 200 plate appearances, from 1992-2017:
| Rank | Name | Year | TAv |
| 1 | Rhys Hoskins | 2017 | .377 |
| 2 | Jason Heyward | 2010 | .374 |
| 3 | Gary Sanchez | 2016 | .362 |
| 4 | Jon Jay | 2010 | .354 |
| 5 | Chris Duncan | 2006 | .351 |
| 6 | Yasiel Puig | 2013 | .350 |
| 7 | Ryan Braun | 2007 | .346 |
| 8 | Albert Pujols | 2001 | .345 |
| 9 | Brian Giles | 1997 | .343 |
| 10 | Logan Morrison | 2010 | .342 |
| 11 | Brennan Boesch | 2010 | .338 |
| 12 | Desmond Jennings | 2011 | .336 |
Of the 50 best 200-PA debuts in our window, 32 percent of have come in the past three years—a timeframe during which 214 hitters hit the threshold, comprising just 13.9 percent of our sample.
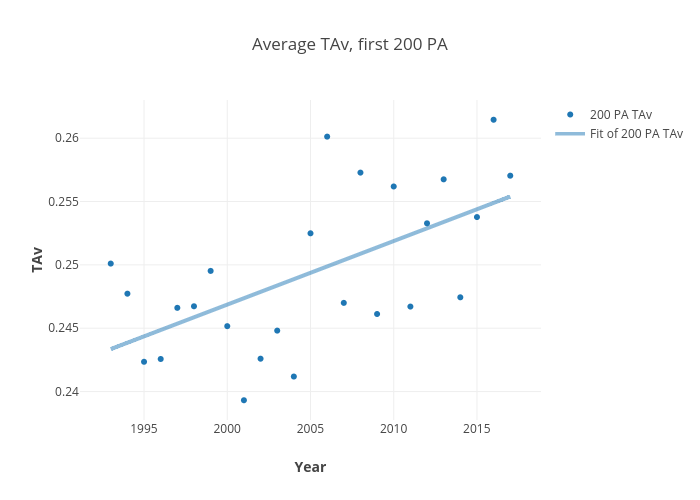
Zoom out, and the picture unsurprisingly becomes murkier. Plotting the average TAv of each class to reach these thresholds, there is an upward trendline over time, but it won’t convince anyone to bet on it continuing. Especially through 400 plate appearances, the variance is tough to look past.
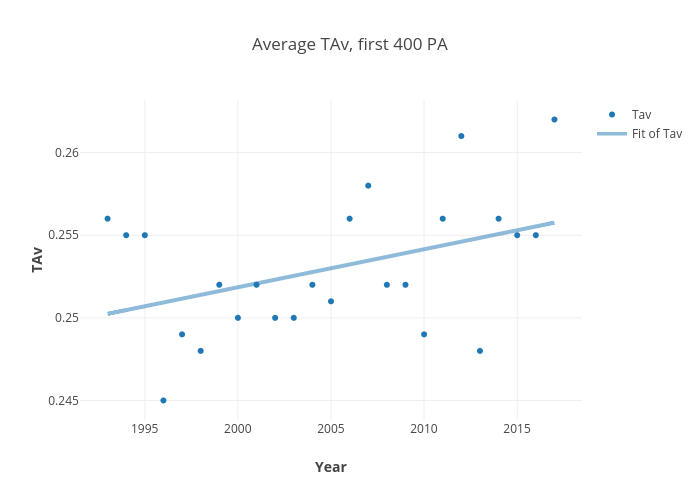
By r-squared, a statistical measure of correlation where a number closer to 1 indicates a stronger relationship, the chart above registers a weak 0.17. The shorter, more immediate 200-PA split shows a stronger curve upward, with an r-squared of 0.36.
Still, the overall shape of rookie production has not changed so noticeably or so consistently that we should draw sweeping conclusions. There are still the ups and downs that you’d expect given that each dot represents an entirely different group of individual ballplayers boasting their own individual talents and fighting to overcome their own individual limitations. The down years have been less down, though. And the heights of recent years have been sort of incomprehensibly high. In 2016 and 2017, brand new major-league hitters produced at basically league-average levels.
Our classes of players earning their stripes have also generally been larger in the 2010s as the game has moved to fully embrace (or capitalize on) rosters populated by young, controllable talents and all the benefits thereof, diminishing the possibility that our outliers are carrying undue weight. At best, an argument for the quirk-of-the-universe theory could be made that baseline expectations for a newly promoted position player might be holding steady, just with more immediate stars breaking ahead of the pack. It would go hand-in-hand with the idea that there has been an unlikely cluster of elite prospects rising through the ranks—coincidence adjacent, basically.
The trouble is, this data doesn’t support the idea that we’re just seeing mega-prospects come up and assume their star-like poses. Some surely are—Kris Bryant and Carlos Correa each rank in the top 60 of both lists—but for every apparent mainstay of the MVP races, there is a Joc Pederson, or an Aledmys Diaz, or the aforementioned Schimpf. The early high-performers are not necessarily sustaining this at all. You don’t have to look very far to find other, older examples of this phenomenon (2006 Chris Duncan says hello), but that doesn’t diminish the curiosity of why these white-hot debuts have become more frequent.
As for the shape of the prodigious production, well, your go-to anecdotal guess would probably prove correct. Recent debutantes are making hay with their slugging numbers. Translation: It’s the dingers! As any baseball trivia whiz probably knows by now, the records on the highest homer totals through 200 PA have been re-written recently. In our two-and-a-half-decade span, the top of the list goes Gary Sanchez, Rhys Hoskins, Cody Bellinger, Jose Abreu (who qualifies as ancient history at this point), Aaron Judge, and Matt Olson. So yes, there have been many dingers, and odds are one or two of these names will look very funny in 15 years.
But lest we look too sharply at the recent home run surge as a cause here, rather than a mold to which this production has conformed, remember that we are using an era-adjusted, opponent-adjusted statistic that measures these performances against the league (aka all the other hitters benefiting from the shifting offensive environment). Olson, for example, loses ground by this method compared to where he would rank by OPS+. So even when we mentally block out the obvious inflation of our flashiest counting stat, we are left to gawk at these newly christened sluggers bursting out of the gates, kicking ahead of those who have accrued more familiarity with major-league pitching.
Even if it doesn’t meet our full definition of a thing, it is worth tracking—both because it might reach Full Thing Status, and because we could learn something about player development and the contemporary divide between the minors and majors. What factors do we even consider as we seek an explanation for this barrage of elite performances? Well, that’s a more complicated question—to be answered in Part 2.
Many thanks to Martin Alonso for the research assistance that made this article possible.
Thank you for reading
This is a free article. If you enjoyed it, consider subscribing to Baseball Prospectus. Subscriptions support ongoing public baseball research and analysis in an increasingly proprietary environment.
Subscribe now
A proposed followup would be to analyze how these recent first year wunderkids end up doing in subsequent years.