
One of the key sabermetric principles is that 10 runs roughly equals one win. Former BP editor-in-chief Ben Lindbergh wrote this in his 2013 Grantland article about the pitch framing wizardry of Jose Molina:
… Molina has saved his teams 111 runs—or, using the standard 10-runs-to-a-win conversion, about 11 wins—because of his framing from 2008 to 2013.
Ten runs to a win may be standard, but it sure isn’t intuitive. You need 10 runs to win a game? Teams scored 10 or more runs in a game only 422 times last year. That’s fewer than nine percent of all games. And they won 405 of those games, for a .960 winning percentage. Why do you need 10 runs? Why not seven? Teams that scored seven runs won 83 percent of the time. Or six? Those teams won 72 percent of their games. Or five: 62 percent. Four’s the dividing line; teams that scored four runs in 2017 lost more than half of their games. But why 10? That’s twice five, and teams scoring five won nearly two-thirds of the time.
The reason is mathematical. (Feel free to skip the next few paragraphs, if that’s not your thing.) The basic regression equation is y = mx + b. The thing you’re trying to predict, y, can be expressed as a multiple m (the slope) of the data you’ve got, x, plus a constant, b (the intercept). For example, if you’re converting Celsius to Fahrenheit, the equation is F = 1.8C + 32. The variable you’re trying to model, degrees Fahrenheit, is equal to a multiple of 1.8 times the data point you have, degrees Celsius, plus a constant of 32. If you’re on vacation in Canada and you hear that the high is going to be 25, wear short sleeves—that’s 1.8 x 25 + 32 = 77 to Americans.
That’s an exact equation. Usually regression equations aren’t exact, but they’ll get you pretty close to the desired number. So I’m going to use regression to predict wins based on run differential. The Indians had the best run differential in the majors last year, at +254 (818 scored, 564 allowed). They won 102 games. The Padres had the worst, at -212 (604 scored, 816 allowed). They won 71. The Indians didn’t win the most games in the majors (the Dodgers did, 104), but they were close. The Padres didn’t win the fewest in the majors (the Giants did, 64), but they were close.
I went through every team for every season since 1901, when the American League was formed. That gave me 2,468 team seasons. For each, I calculated the run differential (my x’s) and the team’s wins (my y’s). Then I used Excel’s linear regression software (you didn’t expect me to do this by hand, did you?) to generate a regression formula. It is:
Wins = 0.103 x runs differential + 78.2
Looking just at the first figure there, each run gives you 0.103 more wins. Flip that over, and you get a win equal to 1 / .103 = 9.74 runs. Or about 10 runs. Each additional 10 runs scored, compared to runs allowed, equals a win.
Okay, everybody, you can join back in now. We’ve established that, on average since 1901, each additional 10 runs that teams have scored (or, for that matter, prevented) has given them an extra win. That’s not saying you’ve got to score 10 runs to win. It’s saying that after 117 seasons involving 2,466 teams, every extra 10 runs a team scores relative to the runs it allows equals one more win. But that’s not an immutable number. The average team scored 5.14 runs per game in 2000. Twelve years earlier, the average team scored exactly one run per game fewer. Surely the number of extra runs needed to eke out a win wasn’t the same in 1988 as in 2000, right?
Yes, it was different. That 10 (or, more accurately, 9.74) runs per game is a long-term average. But it varies. How much does it vary? To answer that, I calculated the regression relationship (described in the paragraphs that some of you skipped) for every year from 1901 to 2017. Here’s a graph showing the number of net additional runs that equaled a win over those years.
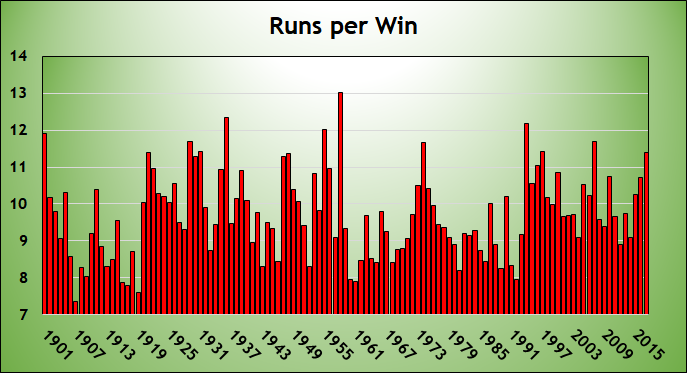
In 1988, when teams scored 4.14 runs per game, an additional 8.89 net runs per season equated an extra win. In 2000, when teams scored 5.14 runs per game, an extra win equaled 10.86 runs. So yes, the runs per win varies according to the scoring environment.
Here’s the same graph, but I added runs per team per game as a black line. The scale is on the right axis. As you can see, while the red bars are kind of noisy, the more scoring, the more runs required per win.
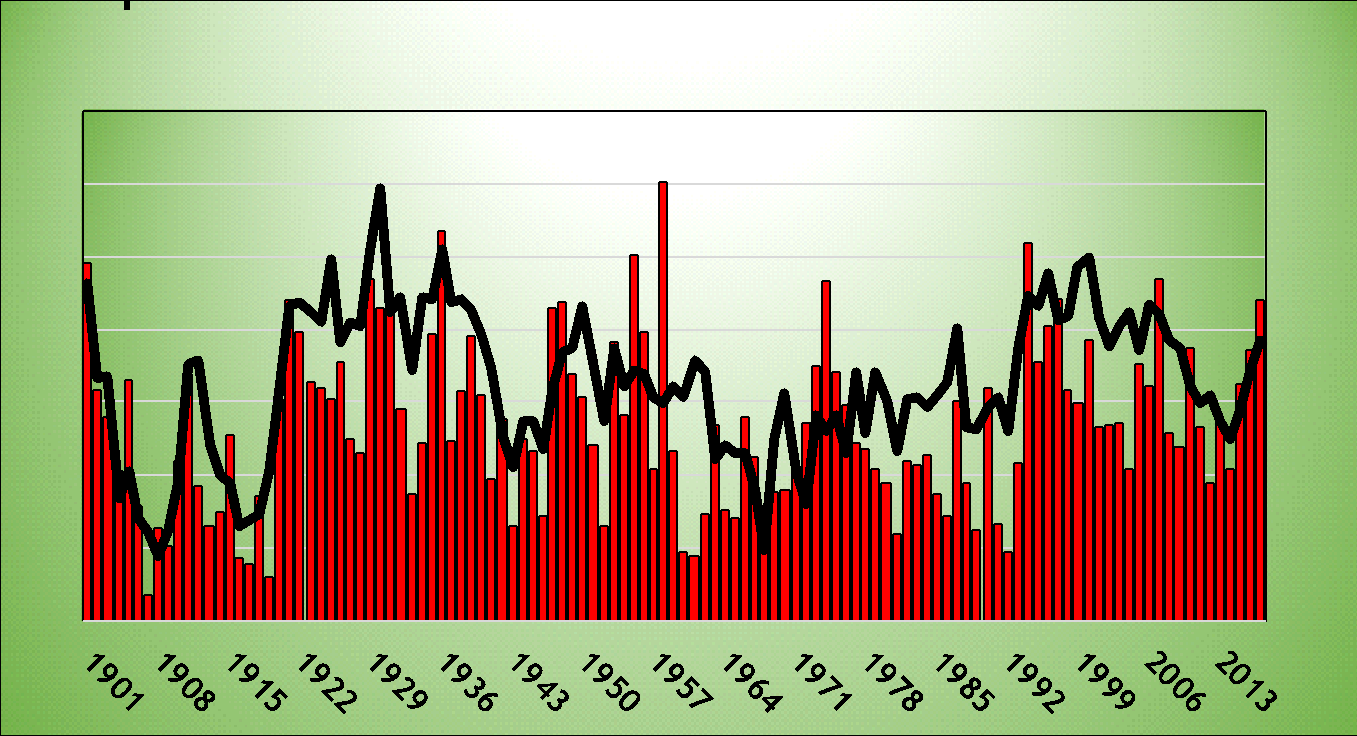
The correlation between runs per game and runs per win is 0.61. That’s pretty high! It means that the more runs scored, the more runs it takes to get an extra win. That makes sense, right? In 1968, the Year of the Pitcher, teams scored only 3.42 runs per game. In 1930, the National League batted .303/.360/.448 and teams scored 5.55 runs per game. So obviously, you needed more runs to secure a win in 1930 than in 1968. And you did, using the formula above: 11.3 runs in 1930, 8.4 runs in 1968.
So you’re OK, on average, if you do the mental math that 10 runs equals a win. But if you want to be really precise, you need to go further, and look at the scoring environment. If you said “10 runs per game” in 2012, you were more than a full run too high. If you said it this past season, you were more than a run too low. As with many things in sabermetrics and life, it’s relative.
Thank you for reading
This is a free article. If you enjoyed it, consider subscribing to Baseball Prospectus. Subscriptions support ongoing public baseball research and analysis in an increasingly proprietary environment.
Subscribe now