On Monday, we talked a bit about a piece I wrote at the beginning of April, one centered on the league-wide plunge in two-out offense that occurred in 2014. As I showed, that trend reversed itself in 2015, bringing offense back up overall almost all by itself. We talked about what distinguishes two-out plate appearances from others, and about the idea that the league’s surge in two-out production in 2015 bespoke an approach change by all (or many) hitters.
Today, I want to dive into what I believe to be the biggest reason for the recovery of two-out offense, and what might be the biggest offensive trend story of 2015. As it happens, I wrote about this back in the spring, too. It’s early-count aggressiveness, and especially, first-pitch swing rates.
As you probably know, the global strikeout rate stabilized this year. (Hooray!) For the first time since 2006, batters didn’t strike out measurably more than they did the previous season.
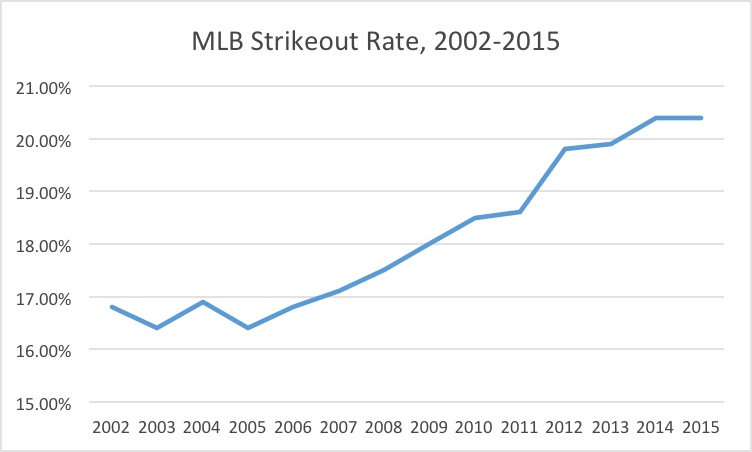
That’s sort of strange, really, because at least as far back as 2008, contact rate has declined every season, including (and especially) from 2014 to 2015.
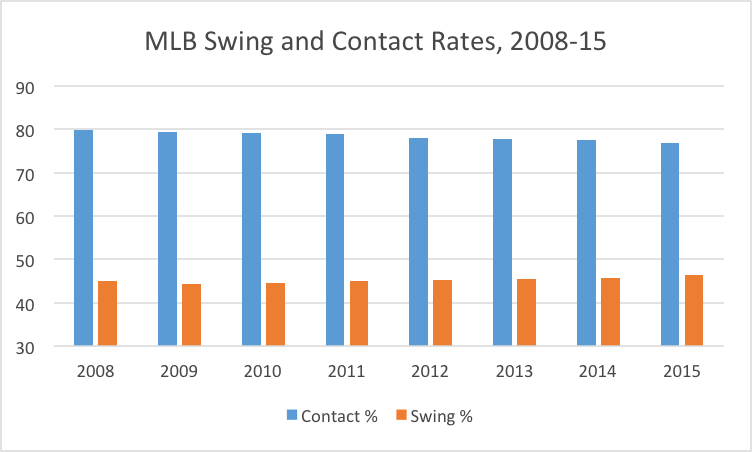
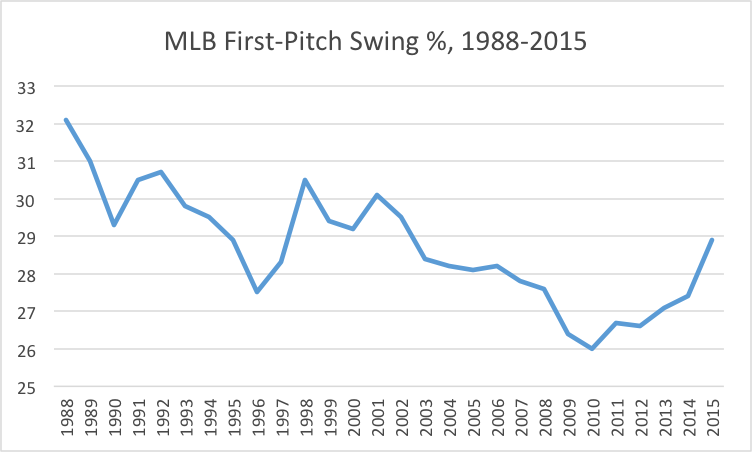
So how did strikeouts cease their growth this season? The answer is found, in part, in the other bars in the graph above: hitters simply got more aggressive. With the strike zone only growing, batters no longer saw much point in waiting out their opponents, so they went to the plate looking to do damage. First-pitch swing rates rose to their highest level since 2002.
Obviously, there remain a lot of advantages to taking the first pitch. In 2015, the OBP for batters when they took the first pitch of a plate appearance was .327. When they swung at that first pitch, their OBP was .292. Still, they came out ahead with the strategy, for two reasons:
- Pitchers remain committed to getting ahead of batters, so very often, the first pitch of the at-bat is the best (and maybe only) one to hit; and
- Given the frightening rate of strikeouts once counts reach two strikes in today’s game, avoiding such counts is the only way to maintain a semblance of control of the matchup (for most batters).
This has been everywhere, in every player whose statistics I have combed through over the last two months. Obviously, not everyone could get more swing-happy, but if there was room to do so (especially isolating early-count swings), most people did. Of the 87 players who qualified for the batting title in each of the last two years, 54 had a higher first-pitch swing rate in 2015—and a handful of others, like Evan Longoria and Robinson Cano, came down slightly after huge increases in first-pitch swings from 2013 to 2014.
Early-count swinging is a young man’s game. In a world where only jumping on a pitcher’s first decent offering gives one a chance for success, offense has to be driven by BABIP and power, and not by plate discipline. That’s why guys like Cano, Longoria, and Jacoby Ellsbury have struggled so badly the last year or two: their attempts to modernize their approaches have coincided with their aging out of the window where they can really avail themselves of the optimal modern approach. A little bit of the electricity is gone from those bats, and when walks are hard to come by and strikeouts keep piling up and the global ground-ball rate just keeps rising, that lost pop is just devastating.
This might help explain the breakout Cubs. Joe Maddon’s charges were absolute first-pitch assassins in 2015. In 667 plate appearances that ended on the first pitch, the Cubs had a 1.060 OPS. That’s the second-best first-pitch team OPS in the period for which we have pitch-by-pitch data (since 1988), trailing only the 2004 Red Sox. They were just eighth in first-pitch swing rate, but when the Cubs’ young sluggers cut it loose early, very good things happened.
I’m not sure this is good news, if you’re among those who hoped the upturn in scoring this season signaled the end of the era of pitchers dominating the league. This is a fairly simple adjustment batters have made, and the counter-adjustment from pitchers next season could be just as simple: throw fewer strikes.
Remember the 1980s, when perfectly good starting pitchers would walk every eighth batter they faced, or thereabouts? We didn’t have pitch-by-pitch data for most of those years, but that began in 1988. That year remains the one with the highest documented rate of first-pitch swings, league-wide. It’s possible that hitters of that era were so aggressive that there came a point of negative returns for pitchers to throw more strikes. In the 25 years since, that hasn’t been true, but with batters still freely (and perhaps involuntarily) trading contact for power all the time, it might be nearly true again.
I feel certain that we’ll see fewer pitchers attacking the strike zone early in counts next year, and since hurlers still seem to be able to miss opponents’ bats almost at will, that could stunt any forward progress for offense. At the very least, it will continue a strange distortion of the shape of scoring that has been happening for five years or so. Then again, maybe I’m wrong about the nature of the dynamic (back in the 1980s, especially, because it seems somewhat clear what’s driving the current interplay of pitchers and hitters), and things will turn in another direction. All I can tell you for sure, I think, is that we haven’t found stasis yet. The batter-pitcher matchup remains a bit out of balance, and both sides are going to keep making changes to their thinking and their execution until something larger gives.
Thank you for reading
This is a free article. If you enjoyed it, consider subscribing to Baseball Prospectus. Subscriptions support ongoing public baseball research and analysis in an increasingly proprietary environment.
Subscribe now
1. Do these stats change at all during the 2nd or 3rd time through the order for the same pitcher. For example, once a pitcher shows the willingness to throw strikes early, does that pitcher than change their approach the 2nd or 3rd time through?
2. Does this approach change the 2nd time through the order, if the batter got a hit on the first pitch the first time through?