| Player | Player Sort | Pos | Salary | Salary Sort | Pct | Pct Sort | WARP | WARP Sort | WARP/$M | WARP/$M Sort | $/WARP | $/WARP Sort | Current Status |
|---|
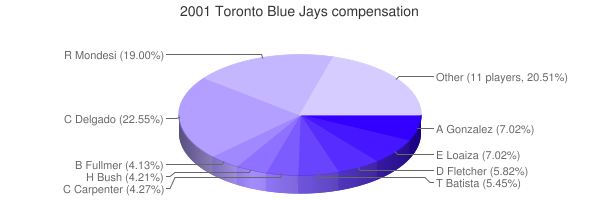
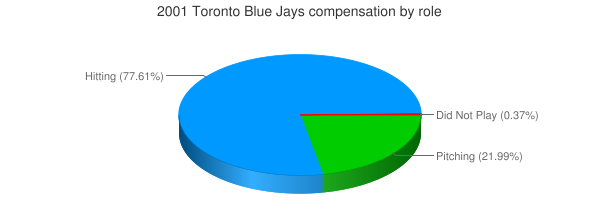
 Carlos Delgado
 |
Delgado Carlos |
1B |
$13,650,000 |
13650000 |
17.88% |
17.88 |
4.33 |
4.33047 |
0.32 |
0.31725054945055 |
$3,152,083 |
3152082.7993266 |
|
 Raul Mondesi
 |
Mondesi Raul |
RF |
$11,500,000 |
11500000 |
15.07% |
15.07 |
2.47 |
2.4681 |
0.21 |
0.21461739130435 |
$4,659,455 |
4659454.641222 |
|
 Joey Hamilton
 |
Hamilton Joey |
RP |
$7,250,000 |
7250000 |
9.50% |
9.50 |
-0.97 |
-0.972191 |
— |
0 |
— |
0 |
|
 Esteban Loaiza
 |
Loaiza Esteban |
RP |
$4,250,000 |
4250000 |
5.57% |
5.57 |
-1.13 |
-1.13449 |
— |
0 |
— |
0 |
|
 Alex Gonzalez
 |
Gonzalez Alex |
SS |
$4,250,000 |
4250000 |
5.57% |
5.57 |
2.00 |
2.00365 |
0.47 |
0.47144705882353 |
$2,121,129 |
2121128.9396851 |
|
 Darrin Fletcher
 |
Fletcher Darrin |
C |
$3,525,000 |
3525000 |
4.62% |
4.62 |
-0.85 |
-0.845123 |
— |
0 |
— |
0 |
|
 Tony Batista
 |
Batista Tony |
3B |
$3,300,000 |
3300000 |
4.32% |
4.32 |
0.40 |
0.402516 |
0.12 |
0.12197454545455 |
$8,198,432 |
8198431.8635781 |
|
 Mike Sirotka
 |
Sirotka Mike |
DNP |
$3,000,000 |
3000000 |
3.93% |
3.93 |
— |
0.00 |
— |
0 |
— |
0 |
|
 Chris Carpenter
 |
Carpenter Chris |
RP |
$2,583,333 |
2583333 |
3.38% |
3.38 |
0.11 |
0.108809 |
0.04 |
0.042119618338015 |
$23,741,906 |
23741905.540902 |
|
 Homer Bush
 |
Bush Homer |
2B |
$2,550,000 |
2550000 |
3.34% |
3.34 |
1.28 |
1.28253 |
0.50 |
0.50295294117647 |
$1,988,258 |
1988257.5846179 |
|
 Brad Fullmer
 |
Fullmer Brad |
DH |
$2,500,000 |
2500000 |
3.28% |
3.28 |
1.29 |
1.28909 |
0.52 |
0.515636 |
$1,939,353 |
1939352.5665392 |
|
 Jose Cruz
 |
Cruz Jose |
CF |
$2,350,000 |
2350000 |
3.08% |
3.08 |
1.12 |
1.11511 |
0.47 |
0.47451489361702 |
$2,107,415 |
2107415.4119325 |
|
 Steve Parris
 |
Parris Steve |
RP |
$2,275,000 |
2275000 |
2.98% |
2.98 |
-3.11 |
-3.11432 |
— |
0 |
— |
0 |
|
 Dan Plesac
 |
Plesac Dan |
RP |
$2,200,000 |
2200000 |
2.88% |
2.88 |
1.43 |
1.42668 |
0.65 |
0.64849090909091 |
$1,542,042 |
1542041.663162 |
|
 Shannon Stewart
 |
Stewart Shannon |
LF |
$2,183,333 |
2183333 |
2.86% |
2.86 |
3.59 |
3.59075 |
1.64 |
1.6446185716975 |
$608,044 |
608043.7234561 |
|
 Paul Quantrill
 |
Quantrill Paul |
RP |
$1,800,000 |
1800000 |
2.36% |
2.36 |
1.14 |
1.14114 |
0.63 |
0.63396666666667 |
$1,577,370 |
1577369.9984226 |
|
 Pedro Borbon
 |
Borbon Pedro |
RP |
$1,500,000 |
1500000 |
1.97% |
1.97 |
0.82 |
0.81536 |
0.54 |
0.54357333333333 |
$1,839,678 |
1839678.1789639 |
|
 Kelvim Escobar
 |
Escobar Kelvim |
RP |
$1,500,000 |
1500000 |
1.97% |
1.97 |
2.70 |
2.70306 |
1.80 |
1.80204 |
$554,927 |
554926.63869836 |
|
 Lance Painter
 |
Painter Lance |
RP |
$1,000,000 |
1000000 |
1.31% |
1.31 |
-0.42 |
-0.418307 |
— |
0 |
— |
0 |
|
 Jeff Frye
 |
Frye Jeff |
2B |
$1,000,000 |
1000000 |
1.31% |
1.31 |
-0.02 |
-0.0206845 |
— |
0 |
— |
0 |
|
 Billy Koch
 |
Koch Billy |
RP |
$733,333 |
733333 |
0.96% |
0.96 |
0.22 |
0.215825 |
0.29 |
0.29430695195771 |
$3,397,813 |
3397813.0429746 |
|
 Alberto Castillo
 |
Castillo Alberto |
C |
$725,000 |
725000 |
0.95% |
0.95 |
0.61 |
0.605969 |
0.84 |
0.83581931034483 |
$1,196,431 |
1196430.8405215 |
|
 Scott Eyre
 |
Eyre Scott |
RP |
$250,000 |
250000 |
0.33% |
0.33 |
0.31 |
0.308053 |
1.23 |
1.232212 |
$811,549 |
811548.66208088 |
|
 Brian Simmons
 |
Simmons Brian |
PH |
$225,000 |
225000 |
0.29% |
0.29 |
-0.38 |
-0.382544 |
— |
0 |
— |
0 |
|
 Chris Woodward
 |
Woodward Chris |
2B |
$223,000 |
223000 |
0.29% |
0.29 |
0.12 |
0.123878 |
0.56 |
0.5555067264574 |
$1,800,158 |
1800158.2201844 |
|
| Year | Blue Jays payroll |
PR Sort |
Avg payroll |
AvgPR Sort |
Diff |
Diff Sort |
|---|
| 2000 | $45,518,332 | 45518332 | $55,368,142 | 55368142 | $-9,849,810 | -9849810 |
| 2001 | $76,322,999 | 76322999 | $64,937,084 | 64937084 | $11,385,915 | 11385915 |
| 2002 | $76,464,333 | 76464333 | $67,238,672 | 67238672 | $9,225,661 | 9225661 |
| 2003 | $49,679,000 | 49679000 | $70,654,480 | 70654480 | $-20,975,480 | -20975480 |
| 2004 | $49,018,000 | 49018000 | $69,466,729 | 69466729 | $-20,448,729 | -20448729 |
| 2005 | $45,801,500 | 45801500 | $74,114,841 | 74114841 | $-28,313,341 | -28313341 |
| 2006 | $69,295,000 | 69295000 | $79,621,815 | 79621815 | $-10,326,815 | -10326815 |
| 2007 | $84,315,000 | 84315000 | $85,537,470 | 85537470 | $-1,222,470 | -1222470 |
| 2008 | $104,368,800 | 104368800 | $92,003,799 | 92003799 | $12,365,001 | 12365001 |
| 2009 | $81,842,100 | 81842100 | $92,169,598 | 92169598 | $-10,327,498 | -10327498 |
| 2010 | $76,189,000 | 76189000 | $94,342,601 | 94342601 | $-18,153,601 | -18153601 |
| 2011 | $70,317,800 | 70317800 | $96,974,710 | 96974710 | $-26,656,910 | -26656910 |
| 2012 | $83,739,200 | 83739200 | $100,947,217 | 100947217 | $-17,208,017 | -17208017 |
| 2013 | $127,777,800 | 127777800 | $108,586,966 | 108586966 | $19,190,834 | 19190834 |
| 2014 | $137,177,700 | 137177700 | $117,131,361 | 117131361 | $20,046,339 | 20046339 |
| 2015 | $125,915,800 | 125915800 | $126,168,161 | 126168161 | $-252,361 | -252361 |
| 2016 | $136,782,027 | 136782027 | $131,756,569 | 131756569 | $5,025,458 | 5025458 |
| 2017 | $163,381,937 | 163381937 | $136,337,445 | 136337445 | $27,044,492 | 27044492 |
| 2018 | $162,037,223 | 162037223 | $135,360,600 | 135360600 | $26,676,623 | 26676623 |
| 2019 | $117,546,171 | 117546171 | $134,792,134 | 134792134 | $-17,245,963 | -17245963 |
| 2020 | $108,987,471 | 108987471 | $139,496,467 | 139496467 | $-30,508,996 | -30508996 |
| 2021 | $140,375,671 | 140375671 | $130,712,288 | 130712288 | $9,663,383 | 9663383 |
| 2022 | $166,851,121 | 166851121 | $149,802,695 | 149802695 | $17,048,426 | 17048426 |
| 2023 | $186,938,983 | 186938983 | $161,692,345 | 161692345 | $25,246,638 | 25246638 |
| 2024 | $181,399,600 | 181399600 | $136,306,249 | 136306249 | $45,093,351 | 45093351 |
| 2025 | $130,750,000 | 130750000 | $98,329,527 | 98329527 | $32,420,473 | 32420473 |
| 2026 | $95,166,667 | 95166667 | $78,039,273 | 78039273 | $17,127,394 | 17127394 |
| 2027 | $30,000,000 | 30000000 | $60,919,343 | 60919343 | $-30,919,343 | -30919343 |
| 2028 | $30,000,000 | 30000000 | $46,901,712 | 46901712 | $-16,901,712 | -16901712 |
|
 2001 Toronto Blue Jays