| Player | Player Sort | Pos | Salary | Salary Sort | Pct | Pct Sort | WARP | WARP Sort | WARP/$M | WARP/$M Sort | $/WARP | $/WARP Sort | Current Status |
|---|
 Chris Young
 |
Young Chris |
CF |
$8,700,000 |
8700000 |
14.04% |
14.04 |
0.89 |
0.893078 |
0.10 |
0.10265264367816 |
$9,741,590 |
9741590.3202184 |
|
 Yoenis Céspedes
 |
Cespedes Yoenis |
LF |
$8,500,000 |
8500000 |
13.72% |
13.72 |
2.46 |
2.45658 |
0.29 |
0.28900941176471 |
$3,460,095 |
3460094.928722 |
|
 Coco Crisp
 |
Crisp Coco |
CF |
$7,000,000 |
7000000 |
11.30% |
11.30 |
4.07 |
4.06866 |
0.58 |
0.58123714285714 |
$1,720,468 |
1720468.1639655 |
|
 Brett Anderson
 |
Anderson Brett |
RP |
$5,750,000 |
5750000 |
9.28% |
9.28 |
-0.09 |
-0.0857983 |
— |
0 |
— |
0 |
|
 Grant Balfour
 |
Balfour Grant |
RP |
$4,500,000 |
4500000 |
7.26% |
7.26 |
1.52 |
1.52475 |
0.34 |
0.33883333333333 |
$2,951,303 |
2951303.4923758 |
|
 Seth Smith
 |
Smith Seth |
DH |
$3,675,000 |
3675000 |
5.93% |
5.93 |
1.07 |
1.0701 |
0.29 |
0.29118367346939 |
$3,434,258 |
3434258.4805158 |
|
 Bartolo Colon
 |
Colon Bartolo |
RP |
$3,000,000 |
3000000 |
4.84% |
4.84 |
3.89 |
3.88649 |
1.30 |
1.2954966666667 |
$771,905 |
771904.72637264 |
|
 Hiroyuki Nakajima
 |
Nakajima Hiroyuki |
DNP |
$2,875,000 |
2875000 |
4.64% |
4.64 |
— |
0.00 |
— |
0 |
— |
0 |
|
 Jed Lowrie
 |
Lowrie Jed |
SS |
$2,400,000 |
2400000 |
3.87% |
3.87 |
3.67 |
3.66593 |
1.53 |
1.5274708333333 |
$654,677 |
654676.98510337 |
|
 John Jaso
 |
Jaso John |
C |
$1,800,000 |
1800000 |
2.90% |
2.90 |
0.87 |
0.868081 |
0.48 |
0.48226722222222 |
$2,073,539 |
2073539.2204184 |
|
 Brandon Moss
 |
Moss Brandon |
1B |
$1,600,000 |
1600000 |
2.58% |
2.58 |
3.45 |
3.45169 |
2.16 |
2.15730625 |
$463,541 |
463541.04800837 |
|
 Chris Resop
 |
Resop Chris |
RP |
$1,350,000 |
1350000 |
2.18% |
2.18 |
-0.01 |
-0.0127181 |
— |
0 |
— |
0 |
|
 Jerry Blevins
 |
Blevins Jerry |
RP |
$1,100,000 |
1100000 |
1.78% |
1.78 |
0.40 |
0.397276 |
0.36 |
0.36116 |
$2,768,856 |
2768855.9087385 |
|
 Daric Barton
 |
Barton Daric |
1B |
$1,100,000 |
1100000 |
1.78% |
1.78 |
1.14 |
1.14409 |
1.04 |
1.0400818181818 |
$961,463 |
961462.82198079 |
|
 Pat Neshek
 |
Neshek Pat |
RP |
$975,000 |
975000 |
1.57% |
1.57 |
0.61 |
0.607797 |
0.62 |
0.62338153846154 |
$1,604,154 |
1604154.0185292 |
|
 Adam Rosales
 |
Rosales Adam |
SS |
$700,000 |
700000 |
1.13% |
1.13 |
0.49 |
0.488841 |
0.70 |
0.69834428571429 |
$1,431,958 |
1431958.4486571 |
|
 Josh Reddick
 |
Reddick Josh |
RF |
$510,000 |
510000 |
0.82% |
0.82 |
2.31 |
2.31367 |
4.54 |
4.5366078431373 |
$220,429 |
220429.01537384 |
|
 Ryan Cook
 |
Cook Ryan |
RP |
$505,000 |
505000 |
0.81% |
0.81 |
1.35 |
1.34796 |
2.67 |
2.6692277227723 |
$374,640 |
374640.19703849 |
|
 Scott Sizemore
 |
Sizemore Scott |
2B |
$500,000 |
500000 |
0.81% |
0.81 |
-0.06 |
-0.0618936 |
— |
0 |
— |
0 |
|
 Evan Scribner
 |
Scribner Evan |
RP |
$495,000 |
495000 |
0.80% |
0.80 |
-0.03 |
-0.0260305 |
— |
0 |
— |
0 |
|
 Eric Sogard
 |
Sogard Eric |
2B |
$495,000 |
495000 |
0.80% |
0.80 |
1.31 |
1.31476 |
2.66 |
2.6560808080808 |
$376,495 |
376494.56935106 |
|
 Tommy Milone
 |
Milone Tommy |
RP |
$495,000 |
495000 |
0.80% |
0.80 |
1.63 |
1.62599 |
3.28 |
3.2848282828283 |
$304,430 |
304429.91654315 |
|
 Jarrod Parker
 |
Parker Jarrod |
RP |
$495,000 |
495000 |
0.80% |
0.80 |
1.59 |
1.58993 |
3.21 |
3.2119797979798 |
$311,334 |
311334.46126559 |
|
 Josh Donaldson
 |
Donaldson Josh |
3B |
$492,500 |
492500 |
0.79% |
0.79 |
6.17 |
6.17201 |
12.53 |
12.532 |
$79,796 |
79795.72294925 |
|
 A.J. Griffin
 |
Griffin A.J. |
RP |
$492,500 |
492500 |
0.79% |
0.79 |
2.41 |
2.40846 |
4.89 |
4.8902741116751 |
$204,488 |
204487.51484351 |
|
 Sean Doolittle
 |
Doolittle Sean |
RP |
$492,500 |
492500 |
0.79% |
0.79 |
1.06 |
1.06342 |
2.16 |
2.1592284263959 |
$463,128 |
463128.39705855 |
|
 Dan Straily
 |
Straily Dan |
RP |
$492,500 |
492500 |
0.79% |
0.79 |
1.66 |
1.65719 |
3.36 |
3.3648527918782 |
$297,190 |
297189.82132405 |
|
 Derek Norris
 |
Norris Derek |
C |
$492,500 |
492500 |
0.79% |
0.79 |
2.51 |
2.51156 |
5.10 |
5.099614213198 |
$196,093 |
196093.26474382 |
|
 Fernando Rodriguez Jr.
 |
Rodriguez Jr. Fernando |
DNP |
$492,000 |
492000 |
0.79% |
0.79 |
— |
0.00 |
— |
0 |
— |
0 |
|
 Nate Freiman
 |
Freiman Nate |
1B |
$490,000 |
490000 |
0.79% |
0.79 |
0.05 |
0.0478837 |
0.10 |
0.097721836734694 |
$10,233,127 |
10233127.348137 |
|
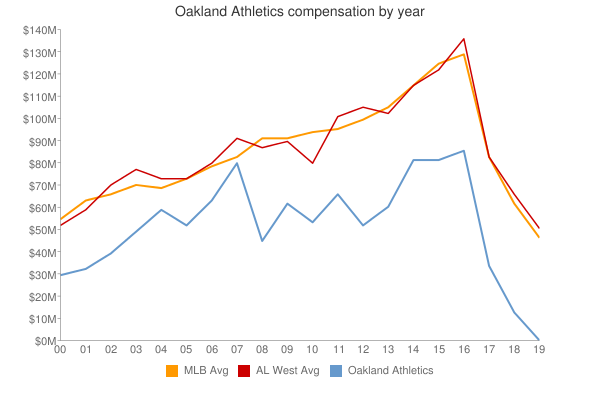
| Year | Athletics payroll |
PR Sort |
Avg payroll |
AvgPR Sort |
Diff |
Diff Sort |
|---|
| 1979 | $21,000 | 21000 | $48,000 | 48000 | $-27,000 | -27000 |
| 1981 | $185,000 | 185000 | $92,500 | 92500 | $92,500 | 92500 |
| 1982 | $535,000 | 535000 | $267,500 | 267500 | $267,500 | 267500 |
| 1983 | $800,000 | 800000 | $400,000 | 400000 | $400,000 | 400000 |
| 1984 | $950,000 | 950000 | $260,000 | 260000 | $690,000 | 690000 |
| 1987 | $72,500 | 72500 | $589,500 | 589500 | $-517,000 | -517000 |
| 1988 | $250,000 | 250000 | $732,083 | 732083 | $-482,083 | -482083 |
| 1989 | $455,000 | 455000 | $862,714 | 862714 | $-407,714 | -407714 |
| 1990 | $3,750,000 | 3750000 | $1,203,571 | 1203571 | $2,546,429 | 2546429 |
| 1991 | $6,100,000 | 6100000 | $1,884,642 | 1884642 | $4,215,358 | 4215358 |
| 1992 | $5,950,000 | 5950000 | $2,356,071 | 2356071 | $3,593,929 | 3593929 |
| 1993 | $7,250,000 | 7250000 | $3,410,000 | 3410000 | $3,840,000 | 3840000 |
| 1994 | $7,800,000 | 7800000 | $3,911,904 | 3911904 | $3,888,096 | 3888096 |
| 1995 | $10,700,000 | 10700000 | $5,208,333 | 5208333 | $5,491,667 | 5491667 |
| 1996 | $7,000,000 | 7000000 | $4,583,416 | 4583416 | $2,416,584 | 2416584 |
| 1997 | $7,100,000 | 7100000 | $4,892,222 | 4892222 | $2,207,778 | 2207778 |
| 1998 | $9,433,333 | 9433333 | $6,661,904 | 6661904 | $2,771,429 | 2771429 |
| 1999 | $8,833,333 | 8833333 | $7,867,823 | 7867823 | $965,510 | 965510 |
| 2000 | $30,906,333 | 30906333 | $57,491,092 | 57491092 | $-26,584,759 | -26584759 |
| 2001 | $33,404,750 | 33404750 | $67,120,750 | 67120750 | $-33,716,000 | -33716000 |
| 2002 | $40,004,167 | 40004167 | $69,204,705 | 69204705 | $-29,200,538 | -29200538 |
| 2003 | $49,644,266 | 49644266 | $72,156,639 | 72156639 | $-22,512,373 | -22512373 |
| 2004 | $59,150,667 | 59150667 | $71,426,357 | 71426357 | $-12,275,690 | -12275690 |
| 2005 | $53,960,500 | 53960500 | $73,628,169 | 73628169 | $-19,667,669 | -19667669 |
| 2006 | $64,615,625 | 64615625 | $81,192,832 | 81192832 | $-16,577,207 | -16577207 |
| 2007 | $80,777,050 | 80777050 | $85,747,487 | 85747487 | $-4,970,437 | -4970437 |
| 2008 | $46,325,000 | 46325000 | $93,079,041 | 93079041 | $-46,754,041 | -46754041 |
| 2009 | $62,434,450 | 62434450 | $92,957,049 | 92957049 | $-30,522,599 | -30522599 |
| 2010 | $54,457,400 | 54457400 | $94,957,956 | 94957956 | $-40,500,556 | -40500556 |
| 2011 | $67,354,000 | 67354000 | $97,426,414 | 97426414 | $-30,072,414 | -30072414 |
| 2012 | $53,957,500 | 53957500 | $100,689,500 | 100689500 | $-46,732,000 | -46732000 |
| 2013 | $61,964,500 | 61964500 | $106,658,387 | 106658387 | $-44,693,887 | -44693887 |
| 2014 | $82,445,900 | 82445900 | $115,428,670 | 115428670 | $-32,982,770 | -32982770 |
| 2015 | $82,389,167 | 82389167 | $125,458,486 | 125458486 | $-43,069,319 | -43069319 |
| 2016 | $86,806,234 | 86806234 | $130,290,910 | 130290910 | $-43,484,676 | -43484676 |
| 2017 | $81,738,333 | 81738333 | $136,573,000 | 136573000 | $-54,834,667 | -54834667 |
| 2018 | $65,985,833 | 65985833 | $135,681,867 | 135681867 | $-69,696,034 | -69696034 |
| 2019 | $89,135,833 | 89135833 | $134,776,225 | 134776225 | $-45,640,392 | -45640392 |
| 2020 | $96,582,433 | 96582433 | $138,321,485 | 138321485 | $-41,739,052 | -41739052 |
| 2021 | $84,413,334 | 84413334 | $129,635,938 | 129635938 | $-45,222,604 | -45222604 |
| 2022 | $48,943,334 | 48943334 | $147,002,411 | 147002411 | $-98,059,077 | -98059077 |
| 2023 | $56,395,000 | 56395000 | $158,155,877 | 158155877 | $-101,760,877 | -101760877 |
| 2024 | $43,255,000 | 43255000 | $133,074,721 | 133074721 | $-89,819,721 | -89819721 |
| 2025 | $15,000,000 | 15000000 | $94,180,059 | 94180059 | $-79,180,059 | -79180059 |
| 2026 | $15,000,000 | 15000000 | $74,818,461 | 74818461 | $-59,818,461 | -59818461 |
| 2027 | $15,000,000 | 15000000 | $56,972,319 | 56972319 | $-41,972,319 | -41972319 |
| 2028 | $15,000,000 | 15000000 | $45,437,759 | 45437759 | $-30,437,759 | -30437759 |
|
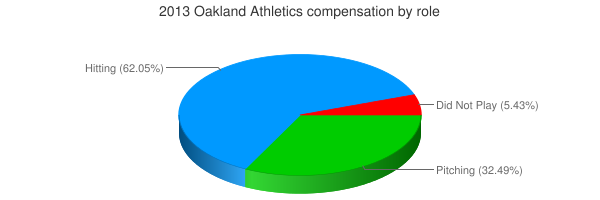
 2013 Oakland Athletics