| Player | Player Sort | Pos | Salary | Salary Sort | Pct | Pct Sort | WARP | WARP Sort | WARP/$M | WARP/$M Sort | $/WARP | $/WARP Sort | Current Status |
|---|
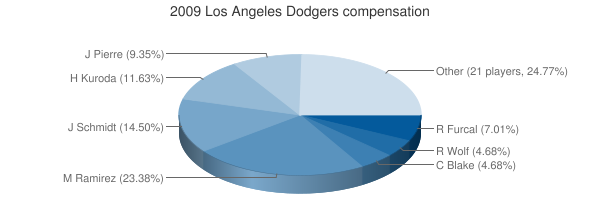
 Manny Ramirez
 |
Ramirez Manny |
LF |
$25,000,000 |
25000000 |
24.06% |
24.06 |
3.36 |
3.35509 |
0.13 |
0.1342036 |
$7,451,365 |
7451364.9410299 |
|
 Jason Schmidt
 |
Schmidt Jason |
RP |
$15,217,401 |
15217401 |
14.65% |
14.65 |
-0.03 |
-0.0253911 |
— |
0 |
— |
0 |
|
 Hiroki Kuroda
 |
Kuroda Hiroki |
RP |
$12,433,333 |
12433333 |
11.97% |
11.97 |
3.22 |
3.22177 |
0.26 |
0.25912359944031 |
$3,859,162 |
3859162.1996604 |
|
 Juan Pierre
 |
Pierre Juan |
LF |
$10,000,000 |
10000000 |
9.63% |
9.63 |
1.45 |
1.45228 |
0.15 |
0.145228 |
$6,885,725 |
6885724.5159336 |
|
 Rafael Furcal
 |
Furcal Rafael |
SS |
$7,500,000 |
7500000 |
7.22% |
7.22 |
4.70 |
4.70381 |
0.63 |
0.62717466666667 |
$1,594,452 |
1594452.1568686 |
|
 Randy Wolf
 |
Wolf Randy |
RP |
$5,000,000 |
5000000 |
4.81% |
4.81 |
6.07 |
6.0705 |
1.21 |
1.2141 |
$823,655 |
823655.38258793 |
|
 Casey Blake
 |
Blake Casey |
3B |
$5,000,000 |
5000000 |
4.81% |
4.81 |
5.28 |
5.27738 |
1.06 |
1.055476 |
$947,440 |
947439.82809652 |
|
 Russell Martin
 |
Martin Russell |
C |
$3,900,000 |
3900000 |
3.75% |
3.75 |
4.97 |
4.97456 |
1.28 |
1.2755282051282 |
$783,989 |
783988.93570487 |
|
 Orlando Hudson
 |
Hudson Orlando |
2B |
$3,380,000 |
3380000 |
3.25% |
3.25 |
3.66 |
3.66494 |
1.08 |
1.0843017751479 |
$922,252 |
922252.47889461 |
|
 Andre Ethier
 |
Ethier Andre |
RF |
$3,100,000 |
3100000 |
2.98% |
2.98 |
4.25 |
4.25055 |
1.37 |
1.3711451612903 |
$729,317 |
729317.38245639 |
|
 Guillermo Mota
 |
Mota Guillermo |
RP |
$2,350,000 |
2350000 |
2.26% |
2.26 |
0.90 |
0.898019 |
0.38 |
0.38213574468085 |
$2,616,871 |
2616871.1352432 |
|
 Jonathan Broxton
 |
Broxton Jonathan |
RP |
$1,825,000 |
1825000 |
1.76% |
1.76 |
2.38 |
2.37503 |
1.30 |
1.3013863013699 |
$768,411 |
768411.34638299 |
|
 Will Ohman
 |
Ohman Will |
RP |
$1,550,000 |
1550000 |
1.49% |
1.49 |
-0.27 |
-0.265807 |
— |
0 |
— |
0 |
|
 Mark Loretta
 |
Loretta Mark |
PH |
$1,250,000 |
1250000 |
1.20% |
1.20 |
-0.48 |
-0.476144 |
— |
0 |
— |
0 |
|
 Brad Ausmus
 |
Ausmus Brad |
C |
$1,000,000 |
1000000 |
0.96% |
0.96 |
0.23 |
0.232579 |
0.23 |
0.232579 |
$4,299,614 |
4299614.3245951 |
|
 Doug Mientkiewicz
 |
Mientkiewicz Doug |
PH |
$550,000 |
550000 |
0.53% |
0.53 |
0.16 |
0.164196 |
0.30 |
0.29853818181818 |
$3,349,655 |
3349655.2900192 |
|
 Jason Repko
 |
Repko Jason |
CF |
$500,000 |
500000 |
0.48% |
0.48 |
-0.07 |
-0.0658634 |
— |
0 |
— |
0 |
|
 Chad Billingsley
 |
Billingsley Chad |
RP |
$475,000 |
475000 |
0.46% |
0.46 |
5.18 |
5.18478 |
10.92 |
10.915326315789 |
$91,614 |
91614.301860445 |
|
 Danny Ardoin
 |
Ardoin Danny |
DNP |
$475,000 |
475000 |
0.46% |
0.46 |
— |
0.00 |
— |
0 |
— |
0 |
Arb2/2011, Arb3/2012, FA/2013 |
 Matt Kemp
 |
Kemp Matt |
CF |
$467,000 |
467000 |
0.45% |
0.45 |
6.94 |
6.93643 |
14.85 |
14.853169164882 |
$67,326 |
67325.699242982 |
|
 James Loney
 |
Loney James |
1B |
$465,000 |
465000 |
0.45% |
0.45 |
1.14 |
1.14239 |
2.46 |
2.456752688172 |
$407,041 |
407041.37816332 |
|
 Hung-Chih Kuo
 |
Kuo Hung-Chih |
RP |
$437,000 |
437000 |
0.42% |
0.42 |
0.68 |
0.675019 |
1.54 |
1.5446659038902 |
$647,389 |
647389.18460073 |
|
 Blake DeWitt
 |
DeWitt Blake |
PH |
$405,000 |
405000 |
0.39% |
0.39 |
-0.04 |
-0.0376447 |
— |
0 |
— |
0 |
|
 Clayton Kershaw
 |
Kershaw Clayton |
RP |
$404,000 |
404000 |
0.39% |
0.39 |
4.56 |
4.56111 |
11.29 |
11.289876237624 |
$88,575 |
88574.930225318 |
|
 Cory Wade
 |
Wade Cory |
RP |
$402,500 |
402500 |
0.39% |
0.39 |
0.66 |
0.659087 |
1.64 |
1.6374832298137 |
$610,693 |
610693.2772153 |
|
 Ramon Troncoso
 |
Troncoso Ramon |
RP |
$401,000 |
401000 |
0.39% |
0.39 |
0.40 |
0.401439 |
1.00 |
1.0010947630923 |
$998,906 |
998906.43410331 |
|
 James McDonald
 |
McDonald James |
RP |
$400,750 |
400750 |
0.39% |
0.39 |
-0.07 |
-0.0705252 |
— |
0 |
— |
0 |
|
| Year | Dodgers payroll |
PR Sort |
Avg payroll |
AvgPR Sort |
Diff |
Diff Sort |
|---|
| 1993 | $245,000 | 245000 | $3,410,000 | 3410000 | $-3,165,000 | -3165000 |
| 1994 | $600,000 | 600000 | $3,911,904 | 3911904 | $-3,311,904 | -3311904 |
| 1995 | $900,000 | 900000 | $5,208,333 | 5208333 | $-4,308,333 | -4308333 |
| 1996 | $2,700,000 | 2700000 | $4,583,416 | 4583416 | $-1,883,416 | -1883416 |
| 1997 | $7,000,000 | 7000000 | $4,892,222 | 4892222 | $2,107,778 | 2107778 |
| 1998 | $8,000,000 | 8000000 | $6,661,904 | 6661904 | $1,338,096 | 1338096 |
| 2000 | $87,696,667 | 87696667 | $56,164,089 | 56164089 | $31,532,578 | 31532578 |
| 2001 | $108,094,167 | 108094167 | $65,991,638 | 65991638 | $42,102,529 | 42102529 |
| 2002 | $95,353,167 | 95353167 | $68,244,471 | 68244471 | $27,108,696 | 27108696 |
| 2003 | $109,350,001 | 109350001 | $71,318,479 | 71318479 | $38,031,522 | 38031522 |
| 2004 | $92,359,334 | 92359334 | $70,466,961 | 70466961 | $21,892,373 | 21892373 |
| 2005 | $82,098,500 | 82098500 | $73,264,780 | 73264780 | $8,833,720 | 8833720 |
| 2006 | $98,804,000 | 98804000 | $79,051,754 | 79051754 | $19,752,246 | 19752246 |
| 2007 | $108,285,563 | 108285563 | $83,931,138 | 83931138 | $24,354,425 | 24354425 |
| 2008 | $119,475,901 | 119475901 | $90,812,373 | 90812373 | $28,663,528 | 28663528 |
| 2009 | $103,887,984 | 103887984 | $91,093,211 | 91093211 | $12,794,773 | 12794773 |
| 2010 | $107,000,283 | 107000283 | $93,373,681 | 93373681 | $13,626,602 | 13626602 |
| 2011 | $108,388,167 | 108388167 | $96,102,034 | 96102034 | $12,286,133 | 12286133 |
| 2012 | $97,600,453 | 97600453 | $100,657,138 | 100657138 | $-3,056,685 | -3056685 |
| 2013 | $223,126,072 | 223126072 | $109,024,990 | 109024990 | $114,101,082 | 114101082 |
| 2014 | $236,199,934 | 236199934 | $117,828,782 | 117828782 | $118,371,152 | 118371152 |
| 2015 | $282,175,296 | 282175296 | $127,404,244 | 127404244 | $154,771,052 | 154771052 |
| 2016 | $250,031,669 | 250031669 | $132,219,407 | 132219407 | $117,812,262 | 117812262 |
| 2017 | $241,149,169 | 241149169 | $137,302,894 | 137302894 | $103,846,275 | 103846275 |
| 2018 | $186,220,715 | 186220715 | $136,929,168 | 136929168 | $49,291,547 | 49291547 |
| 2019 | $196,279,677 | 196279677 | $136,944,257 | 136944257 | $59,335,420 | 59335420 |
| 2020 | $222,033,500 | 222033500 | $140,677,788 | 140677788 | $81,355,712 | 81355712 |
| 2021 | $246,652,833 | 246652833 | $132,162,631 | 132162631 | $114,490,202 | 114490202 |
| 2022 | $280,802,499 | 280802499 | $149,374,046 | 149374046 | $131,428,453 | 131428453 |
| 2023 | $239,277,499 | 239277499 | $160,460,390 | 160460390 | $78,817,109 | 78817109 |
| 2024 | $243,699,999 | 243699999 | $135,504,022 | 135504022 | $108,195,977 | 108195977 |
| 2025 | $203,750,000 | 203750000 | $96,417,302 | 96417302 | $107,332,698 | 107332698 |
| 2026 | $176,250,000 | 176250000 | $76,694,120 | 76694120 | $99,555,880 | 99555880 |
| 2027 | $186,250,000 | 186250000 | $58,935,617 | 58935617 | $127,314,383 | 127314383 |
| 2028 | $149,750,000 | 149750000 | $45,437,759 | 45437759 | $104,312,241 | 104312241 |
| 2029 | $128,250,000 | 128250000 | $37,269,628 | 37269628 | $90,980,372 | 90980372 |
| 2030 | $122,916,667 | 122916667 | $39,665,769 | 39665769 | $83,250,898 | 83250898 |
| 2031 | $120,416,667 | 120416667 | $38,360,152 | 38360152 | $82,056,515 | 82056515 |
| 2032 | $119,416,667 | 119416667 | $47,925,459 | 47925459 | $71,491,208 | 71491208 |
| 2033 | $86,950,000 | 86950000 | $43,068,924 | 43068924 | $43,881,076 | 43881076 |
| 2034 | $28,000,000 | 28000000 | $29,428,571 | 29428571 | $-1,428,571 | -1428571 |
| 2035 | $28,000,000 | 28000000 | $28,000,000 | 28000000 | $0 | 0 |
|
 2009 Los Angeles Dodgers