| Player | Player Sort | Pos | Salary | Salary Sort | Pct | Pct Sort | WARP | WARP Sort | WARP/$M | WARP/$M Sort | $/WARP | $/WARP Sort | Current Status |
|---|
 Kevin Millwood
 |
Millwood Kevin |
RP |
$7,000,000 |
7000000 |
17.13% |
17.13 |
4.80 |
4.79589 |
0.69 |
0.68512714285714 |
$1,459,583 |
1459583.1013639 |
|
 CC Sabathia
 |
Sabathia CC |
RP |
$4,500,000 |
4500000 |
11.01% |
11.01 |
5.52 |
5.52471 |
1.23 |
1.2277133333333 |
$814,522 |
814522.39122053 |
|
 Arthur Rhodes
 |
Rhodes Arthur |
RP |
$3,700,000 |
3700000 |
9.05% |
9.05 |
1.42 |
1.42348 |
0.38 |
0.38472432432432 |
$2,599,264 |
2599263.776098 |
|
 Aaron Boone
 |
Boone Aaron |
3B |
$3,000,000 |
3000000 |
7.34% |
7.34 |
1.10 |
1.10035 |
0.37 |
0.36678333333333 |
$2,726,405 |
2726405.2346981 |
|
 Jake Westbrook
 |
Westbrook Jake |
RP |
$2,900,000 |
2900000 |
7.10% |
7.10 |
5.28 |
5.27684 |
1.82 |
1.8196 |
$549,571 |
549571.3343592 |
|
 Bob Wickman
 |
Wickman Bob |
RP |
$2,750,000 |
2750000 |
6.73% |
6.73 |
1.25 |
1.2497 |
0.45 |
0.45443636363636 |
$2,200,528 |
2200528.1267504 |
|
 Ronnie Belliard
 |
Belliard Ronnie |
2B |
$2,500,000 |
2500000 |
6.12% |
6.12 |
3.14 |
3.14414 |
1.26 |
1.257656 |
$795,130 |
795129.98785041 |
|
 Casey Blake
 |
Blake Casey |
RF |
$2,250,000 |
2250000 |
5.50% |
5.50 |
1.31 |
1.31246 |
0.58 |
0.58331555555556 |
$1,714,338 |
1714337.9607759 |
|
 José Hernández
 |
Hernandez Jose |
1B |
$1,800,000 |
1800000 |
4.40% |
4.40 |
-0.59 |
-0.592843 |
— |
0 |
— |
0 |
|
 David Riske
 |
Riske David |
RP |
$1,425,000 |
1425000 |
3.49% |
3.49 |
1.32 |
1.32289 |
0.93 |
0.92834385964912 |
$1,077,187 |
1077187.0677078 |
|
 Alex Cora
 |
Cora Alex |
SS |
$1,300,000 |
1300000 |
3.18% |
3.18 |
0.29 |
0.290274 |
0.22 |
0.22328769230769 |
$4,478,527 |
4478527.18466 |
|
 Bob Howry
 |
Howry Bob |
RP |
$900,000 |
900000 |
2.20% |
2.20 |
1.32 |
1.3153 |
1.46 |
1.4614444444444 |
$684,255 |
684254.54268988 |
|
 Scott Elarton
 |
Elarton Scott |
RP |
$850,000 |
850000 |
2.08% |
2.08 |
-1.08 |
-1.07841 |
— |
0 |
— |
0 |
|
 Victor Martinez
 |
Martinez Victor |
C |
$700,000 |
700000 |
1.71% |
1.71 |
5.83 |
5.82955 |
8.33 |
8.3279285714286 |
$120,078 |
120077.87908158 |
|
 Juan Gonzalez
 |
Gonzalez Juan |
|
$600,000 |
600000 |
1.47% |
1.47 |
-0.03 |
-0.0275381 |
— |
0 |
— |
0 |
|
 Scott Sauerbeck
 |
Sauerbeck Scott |
RP |
$500,000 |
500000 |
1.22% |
1.22 |
1.09 |
1.08737 |
2.17 |
2.17474 |
$459,825 |
459825.0825386 |
|
 Travis Hafner
 |
Hafner Travis |
DH |
$500,000 |
500000 |
1.22% |
1.22 |
5.49 |
5.49318 |
10.99 |
10.98636 |
$91,022 |
91021.958137181 |
|
 Ben Broussard
 |
Broussard Ben |
1B |
$365,000 |
365000 |
0.89% |
0.89 |
0.83 |
0.833844 |
2.28 |
2.284504109589 |
$437,732 |
437731.75797871 |
|
 Coco Crisp
 |
Crisp Coco |
LF |
$364,900 |
364900 |
0.89% |
0.89 |
4.38 |
4.38179 |
12.01 |
12.00819402576 |
$83,276 |
83276.469205507 |
|
 Jody Gerut
 |
Gerut Jody |
RF |
$356,200 |
356200 |
0.87% |
0.87 |
-0.18 |
-0.179813 |
— |
0 |
— |
0 |
|
 Cliff Lee
 |
Lee Cliff |
RP |
$345,000 |
345000 |
0.84% |
0.84 |
3.30 |
3.30433 |
9.58 |
9.577768115942 |
$104,408 |
104408.457993 |
|
 Jason Davis
 |
Davis Jason |
RP |
$341,700 |
341700 |
0.84% |
0.84 |
0.63 |
0.628504 |
1.84 |
1.8393444541996 |
$543,672 |
543671.95753726 |
|
 Rafael Betancourt
 |
Betancourt Rafael |
RP |
$338,600 |
338600 |
0.83% |
0.83 |
2.34 |
2.34063 |
6.91 |
6.9126698168931 |
$144,662 |
144661.90726428 |
|
 Grady Sizemore
 |
Sizemore Grady |
CF |
$318,300 |
318300 |
0.78% |
0.78 |
4.08 |
4.08186 |
12.82 |
12.823939679548 |
$77,979 |
77979.15656098 |
|
 Josh Bard
 |
Bard Josh |
C |
$317,900 |
317900 |
0.78% |
0.78 |
-0.01 |
-0.0116655 |
— |
0 |
— |
0 |
|
 Ryan Ludwick
 |
Ludwick Ryan |
LF |
$317,500 |
317500 |
0.78% |
0.78 |
0.12 |
0.116569 |
0.37 |
0.36714645669291 |
$2,723,709 |
2723708.7047157 |
|
 Brandon Phillips
 |
Phillips Brandon |
PR |
$316,800 |
316800 |
0.78% |
0.78 |
-0.22 |
-0.223934 |
— |
0 |
— |
0 |
|
 Jhonny Peralta
 |
Peralta Jhonny |
SS |
$316,700 |
316700 |
0.77% |
0.77 |
5.11 |
5.10977 |
16.13 |
16.134417429744 |
$61,979 |
61979.306309286 |
|
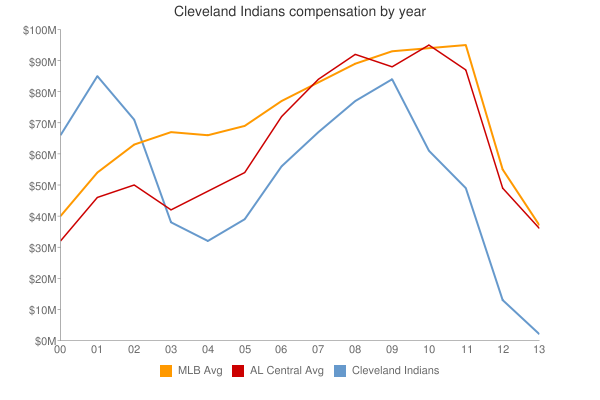
| Year | Indians payroll |
PR Sort |
Avg payroll |
AvgPR Sort |
Diff |
Diff Sort |
|---|
| 2000 | $76,938,090 | 76938090 | $56,164,089 | 56164089 | $20,774,001 | 20774001 |
| 2001 | $93,672,001 | 93672001 | $65,991,638 | 65991638 | $27,680,363 | 27680363 |
| 2002 | $78,691,449 | 78691449 | $68,244,471 | 68244471 | $10,446,978 | 10446978 |
| 2003 | $47,770,900 | 47770900 | $71,318,479 | 71318479 | $-23,547,579 | -23547579 |
| 2004 | $34,910,300 | 34910300 | $70,466,961 | 70466961 | $-35,556,661 | -35556661 |
| 2005 | $40,873,600 | 40873600 | $73,264,780 | 73264780 | $-32,391,180 | -32391180 |
| 2006 | $56,041,800 | 56041800 | $79,051,754 | 79051754 | $-23,009,954 | -23009954 |
| 2007 | $61,452,100 | 61452100 | $83,931,138 | 83931138 | $-22,479,038 | -22479038 |
| 2008 | $77,258,400 | 77258400 | $90,812,373 | 90812373 | $-13,553,973 | -13553973 |
| 2009 | $81,972,100 | 81972100 | $91,093,211 | 91093211 | $-9,121,111 | -9121111 |
| 2010 | $61,203,967 | 61203967 | $93,373,681 | 93373681 | $-32,169,714 | -32169714 |
| 2011 | $49,426,567 | 49426567 | $96,102,034 | 96102034 | $-46,675,467 | -46675467 |
| 2012 | $66,880,300 | 66880300 | $100,657,138 | 100657138 | $-33,776,838 | -33776838 |
| 2013 | $78,955,733 | 78955733 | $109,024,990 | 109024990 | $-30,069,257 | -30069257 |
| 2014 | $86,916,235 | 86916235 | $117,828,782 | 117828782 | $-30,912,547 | -30912547 |
| 2015 | $87,997,101 | 87997101 | $127,404,244 | 127404244 | $-39,407,143 | -39407143 |
| 2016 | $96,304,400 | 96304400 | $132,219,407 | 132219407 | $-35,915,007 | -35915007 |
| 2017 | $124,116,166 | 124116166 | $137,302,894 | 137302894 | $-13,186,728 | -13186728 |
| 2018 | $134,851,566 | 134851566 | $136,929,168 | 136929168 | $-2,077,602 | -2077602 |
| 2019 | $119,575,034 | 119575034 | $136,944,257 | 136944257 | $-17,369,223 | -17369223 |
| 2020 | $92,781,066 | 92781066 | $140,677,788 | 140677788 | $-47,896,722 | -47896722 |
| 2021 | $52,028,300 | 52028300 | $132,162,631 | 132162631 | $-80,134,331 | -80134331 |
| 2022 | $68,037,200 | 68037200 | $149,374,046 | 149374046 | $-81,336,846 | -81336846 |
| 2023 | $89,424,629 | 89424629 | $160,460,390 | 160460390 | $-71,035,761 | -71035761 |
| 2024 | $49,621,429 | 49621429 | $135,504,022 | 135504022 | $-85,882,593 | -85882593 |
| 2025 | $45,171,429 | 45171429 | $96,417,302 | 96417302 | $-51,245,873 | -51245873 |
| 2026 | $53,871,429 | 53871429 | $76,694,120 | 76694120 | $-22,822,691 | -22822691 |
| 2027 | $51,571,429 | 51571429 | $58,935,617 | 58935617 | $-7,364,188 | -7364188 |
| 2028 | $48,571,429 | 48571429 | $45,437,759 | 45437759 | $3,133,670 | 3133670 |
| 2029 | $23,571,429 | 23571429 | $37,269,628 | 37269628 | $-13,698,199 | -13698199 |
| 2030 | $2,500,000 | 2500000 | $39,665,769 | 39665769 | $-37,165,769 | -37165769 |
|
 2005 Cleveland Indians