| Player | Player Sort | Pos | Salary | Salary Sort | Pct | Pct Sort | WARP | WARP Sort | WARP/$M | WARP/$M Sort | $/WARP | $/WARP Sort | Current Status |
|---|
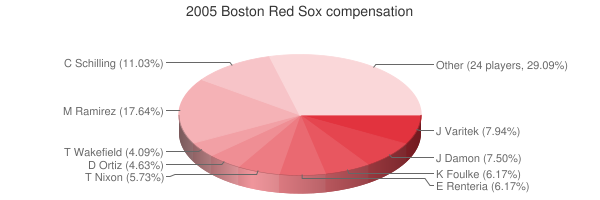
 Manny Ramirez
 |
Ramirez Manny |
LF |
$22,000,000 |
22000000 |
17.59% |
17.59 |
4.36 |
4.36244 |
0.20 |
0.19829272727273 |
$5,043,049 |
5043049.3026838 |
|
 Curt Schilling
 |
Schilling Curt |
RP |
$12,500,000 |
12500000 |
9.99% |
9.99 |
2.01 |
2.01458 |
0.16 |
0.1611664 |
$6,204,767 |
6204767.246771 |
|
 Jason Varitek
 |
Varitek Jason |
C |
$10,000,000 |
10000000 |
7.99% |
7.99 |
3.89 |
3.89361 |
0.39 |
0.389361 |
$2,568,311 |
2568310.6423088 |
|
 Johnny Damon
 |
Damon Johnny |
CF |
$8,500,000 |
8500000 |
6.79% |
6.79 |
5.06 |
5.06078 |
0.60 |
0.59538588235294 |
$1,679,583 |
1679582.9891835 |
|
 Edgar Renteria
 |
Renteria Edgar |
SS |
$8,000,000 |
8000000 |
6.39% |
6.39 |
0.69 |
0.688148 |
0.09 |
0.0860185 |
$11,625,406 |
11625406.162628 |
|
 Keith Foulke
 |
Foulke Keith |
RP |
$7,000,000 |
7000000 |
5.60% |
5.60 |
-0.73 |
-0.733411 |
— |
0 |
— |
0 |
|
 Matt Clement
 |
Clement Matt |
RP |
$6,500,000 |
6500000 |
5.20% |
5.20 |
2.41 |
2.41495 |
0.37 |
0.37153076923077 |
$2,691,567 |
2691567.1131907 |
|
 Trot Nixon
 |
Nixon Trot |
RF |
$6,500,000 |
6500000 |
5.20% |
5.20 |
3.06 |
3.05997 |
0.47 |
0.47076461538462 |
$2,124,204 |
2124203.8320637 |
|
 David Ortiz
 |
Ortiz David |
DH |
$5,250,000 |
5250000 |
4.20% |
4.20 |
5.01 |
5.00588 |
0.95 |
0.95350095238095 |
$1,048,767 |
1048766.6504191 |
|
 Tim Wakefield
 |
Wakefield Tim |
RP |
$4,640,000 |
4640000 |
3.71% |
3.71 |
1.13 |
1.13319 |
0.24 |
0.24422198275862 |
$4,094,635 |
4094635.4980189 |
|
 David Wells
 |
Wells David |
RP |
$4,075,000 |
4075000 |
3.26% |
3.26 |
2.51 |
2.51029 |
0.62 |
0.61602208588957 |
$1,623,318 |
1623318.4213776 |
|
 Kevin Millar
 |
Millar Kevin |
1B |
$3,500,000 |
3500000 |
2.80% |
2.80 |
1.43 |
1.43405 |
0.41 |
0.40972857142857 |
$2,440,640 |
2440640.1450438 |
|
 Jay Payton
 |
Payton Jay |
RF |
$3,500,000 |
3500000 |
2.80% |
2.80 |
0.52 |
0.515121 |
0.15 |
0.14717742857143 |
$6,794,520 |
6794520.1224567 |
|
 Alan Embree
 |
Embree Alan |
RP |
$3,000,000 |
3000000 |
2.40% |
2.40 |
0.51 |
0.513577 |
0.17 |
0.17119233333333 |
$5,841,383 |
5841383.083744 |
|
 Mark Bellhorn
 |
Bellhorn Mark |
2B |
$2,750,000 |
2750000 |
2.20% |
2.20 |
0.74 |
0.739182 |
0.27 |
0.26879345454545 |
$3,720,329 |
3720328.6876574 |
|
 Mike Timlin
 |
Timlin Mike |
RP |
$2,750,000 |
2750000 |
2.20% |
2.20 |
1.56 |
1.5579 |
0.57 |
0.56650909090909 |
$1,765,197 |
1765196.7392002 |
|
 Bill Mueller
 |
Mueller Bill |
3B |
$2,100,000 |
2100000 |
1.68% |
1.68 |
1.67 |
1.66701 |
0.79 |
0.79381428571429 |
$1,259,740 |
1259740.4934583 |
|
 Bronson Arroyo
 |
Arroyo Bronson |
RP |
$1,850,000 |
1850000 |
1.48% |
1.48 |
-1.18 |
-1.18361 |
— |
0 |
— |
0 |
|
 Wade Miller
 |
Miller Wade |
RP |
$1,500,000 |
1500000 |
1.20% |
1.20 |
-0.63 |
-0.631202 |
— |
0 |
— |
0 |
|
 Chad Bradford
 |
Bradford Chad |
RP |
$1,400,000 |
1400000 |
1.12% |
1.12 |
0.36 |
0.363262 |
0.26 |
0.25947285714286 |
$3,853,968 |
3853967.6597057 |
|
 Doug Mirabelli
 |
Mirabelli Doug |
C |
$1,400,000 |
1400000 |
1.12% |
1.12 |
0.84 |
0.842074 |
0.60 |
0.60148142857143 |
$1,662,562 |
1662561.722604 |
|
 John Halama
 |
Halama John |
RP |
$850,000 |
850000 |
0.68% |
0.68 |
0.27 |
0.265505 |
0.31 |
0.31235882352941 |
$3,201,446 |
3201446.3004463 |
|
 Matt Mantei
 |
Mantei Matt |
RP |
$750,000 |
750000 |
0.60% |
0.60 |
-0.52 |
-0.517473 |
— |
0 |
— |
0 |
|
 Roberto Petagine
 |
Petagine Roberto |
1B |
$750,000 |
750000 |
0.60% |
0.60 |
-0.10 |
-0.101421 |
— |
0 |
— |
0 |
|
 Ramón Vázquez
 |
Vazquez Ramon |
SS |
$700,000 |
700000 |
0.56% |
0.56 |
-0.74 |
-0.735795 |
— |
0 |
— |
0 |
|
 Mike Myers
 |
Myers Mike |
RP |
$600,000 |
600000 |
0.48% |
0.48 |
0.54 |
0.54239 |
0.90 |
0.90398333333333 |
$1,106,215 |
1106215.0850864 |
|
 Craig Hansen
 |
Hansen Craig |
RP |
$575,000 |
575000 |
0.46% |
0.46 |
0.02 |
0.0159036 |
0.03 |
0.027658434782609 |
$36,155,336 |
36155335.89879 |
|
 Dave Mccarty
 |
McCarty Dave |
1B |
$550,000 |
550000 |
0.44% |
0.44 |
0.11 |
0.105375 |
0.19 |
0.19159090909091 |
$5,219,454 |
5219454.3297746 |
|
 Matt Miller
 |
Miller Matt |
DNP |
$329,700 |
329700 |
0.26% |
0.26 |
— |
0.00 |
— |
0 |
— |
0 |
|
 Kevin Youkilis
 |
Youkilis Kevin |
3B |
$323,125 |
323125 |
0.26% |
0.26 |
0.51 |
0.514613 |
1.59 |
1.5926127659574 |
$627,899 |
627899.02314943 |
|
 Blaine Neal
 |
Neal Blaine |
RP |
$321,000 |
321000 |
0.26% |
0.26 |
-0.19 |
-0.194995 |
— |
0 |
— |
0 |
|
 Felix Diaz
 |
Diaz Felix |
DNP |
$318,000 |
318000 |
0.25% |
0.25 |
— |
0.00 |
— |
0 |
— |
0 |
|
 Adam Stern
 |
Stern Adam |
PR |
$316,000 |
316000 |
0.25% |
0.25 |
-0.28 |
-0.275151 |
— |
0 |
— |
0 |
|
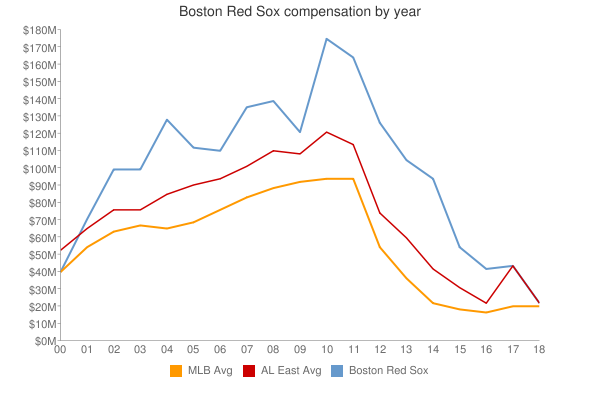
| Year | Red Sox payroll |
PR Sort |
Avg payroll |
AvgPR Sort |
Diff |
Diff Sort |
|---|
| 1997 | $1,100,000 | 1100000 | $4,892,222 | 4892222 | $-3,792,222 | -3792222 |
| 1998 | $9,100,000 | 9100000 | $6,661,904 | 6661904 | $2,438,096 | 2438096 |
| 1999 | $14,500,000 | 14500000 | $7,867,823 | 7867823 | $6,632,177 | 6632177 |
| 2000 | $80,978,533 | 80978533 | $56,164,089 | 56164089 | $24,814,444 | 24814444 |
| 2001 | $111,488,333 | 111488333 | $65,991,638 | 65991638 | $45,496,695 | 45496695 |
| 2002 | $108,645,000 | 108645000 | $68,244,471 | 68244471 | $40,400,529 | 40400529 |
| 2003 | $99,251,500 | 99251500 | $71,318,479 | 71318479 | $27,933,021 | 27933021 |
| 2004 | $128,545,500 | 128545500 | $70,466,961 | 70466961 | $58,078,539 | 58078539 |
| 2005 | $125,097,825 | 125097825 | $73,264,780 | 73264780 | $51,833,045 | 51833045 |
| 2006 | $124,406,500 | 124406500 | $79,051,754 | 79051754 | $45,354,746 | 45354746 |
| 2007 | $147,568,833 | 147568833 | $83,931,138 | 83931138 | $63,637,695 | 63637695 |
| 2008 | $136,798,083 | 136798083 | $90,812,373 | 90812373 | $45,985,710 | 45985710 |
| 2009 | $122,803,640 | 122803640 | $91,093,211 | 91093211 | $31,710,429 | 31710429 |
| 2010 | $173,759,833 | 173759833 | $93,373,681 | 93373681 | $80,386,152 | 80386152 |
| 2011 | $165,828,976 | 165828976 | $96,102,034 | 96102034 | $69,726,942 | 69726942 |
| 2012 | $175,205,284 | 175205284 | $100,657,138 | 100657138 | $74,548,146 | 74548146 |
| 2013 | $150,655,000 | 150655000 | $109,024,990 | 109024990 | $41,630,010 | 41630010 |
| 2014 | $163,414,996 | 163414996 | $117,828,782 | 117828782 | $45,586,214 | 45586214 |
| 2015 | $180,779,329 | 180779329 | $127,404,244 | 127404244 | $53,375,085 | 53375085 |
| 2016 | $197,899,679 | 197899679 | $132,219,407 | 132219407 | $65,680,272 | 65680272 |
| 2017 | $197,041,179 | 197041179 | $137,302,894 | 137302894 | $59,738,285 | 59738285 |
| 2018 | $233,200,428 | 233200428 | $136,929,168 | 136929168 | $96,271,260 | 96271260 |
| 2019 | $236,171,428 | 236171428 | $136,944,257 | 136944257 | $99,227,171 | 99227171 |
| 2020 | $187,907,969 | 187907969 | $140,677,788 | 140677788 | $47,230,181 | 47230181 |
| 2021 | $176,099,500 | 176099500 | $132,162,631 | 132162631 | $43,936,869 | 43936869 |
| 2022 | $212,015,000 | 212015000 | $149,374,046 | 149374046 | $62,640,954 | 62640954 |
| 2023 | $154,435,000 | 154435000 | $160,460,390 | 160460390 | $-6,025,390 | -6025390 |
| 2024 | $97,266,667 | 97266667 | $135,504,022 | 135504022 | $-38,237,355 | -38237355 |
| 2025 | $86,566,667 | 86566667 | $96,417,302 | 96417302 | $-9,850,635 | -9850635 |
| 2026 | $73,916,667 | 73916667 | $76,694,120 | 76694120 | $-2,777,453 | -2777453 |
| 2027 | $71,416,667 | 71416667 | $58,935,617 | 58935617 | $12,481,050 | 12481050 |
| 2028 | $59,916,667 | 59916667 | $45,437,759 | 45437759 | $14,478,908 | 14478908 |
| 2029 | $59,916,667 | 59916667 | $37,269,628 | 37269628 | $22,647,039 | 22647039 |
| 2030 | $44,750,000 | 44750000 | $39,665,769 | 39665769 | $5,084,231 | 5084231 |
| 2031 | $44,000,000 | 44000000 | $38,360,152 | 38360152 | $5,639,848 | 5639848 |
| 2032 | $35,000,000 | 35000000 | $47,925,459 | 47925459 | $-12,925,459 | -12925459 |
| 2033 | $31,000,000 | 31000000 | $43,068,924 | 43068924 | $-12,068,924 | -12068924 |
|
 2005 Boston Red Sox