| Player | Player Sort | Pos | Salary | Salary Sort | Pct | Pct Sort | WARP | WARP Sort | WARP/$M | WARP/$M Sort | $/WARP | $/WARP Sort | Current Status |
|---|
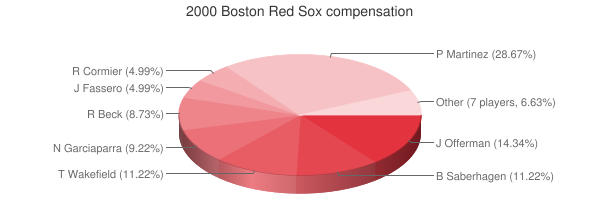
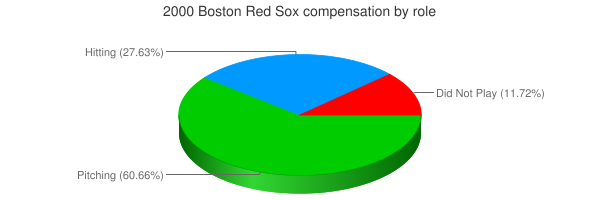
 Pedro Martinez
 |
Martinez Pedro |
RP |
$11,500,000 |
11500000 |
14.20% |
14.20 |
9.66 |
9.65798 |
0.84 |
0.83982434782609 |
$1,190,725 |
1190725.1826987 |
|
 Ramon Martinez
 |
Martinez Ramon |
RP |
$9,320,000 |
9320000 |
11.51% |
11.51 |
-0.03 |
-0.0263138 |
— |
0 |
— |
0 |
|
 John Valentin
 |
Valentin John |
3B |
$6,350,000 |
6350000 |
7.84% |
7.84 |
0.02 |
0.0183538 |
0.00 |
0.0028903622047244 |
$345,977,400 |
345977399.77552 |
|
 Jose Offerman
 |
Offerman Jose |
2B |
$5,750,000 |
5750000 |
7.10% |
7.10 |
1.65 |
1.65435 |
0.29 |
0.28771304347826 |
$3,475,685 |
3475685.314474 |
|
 Carl Everett
 |
Everett Carl |
CF |
$5,000,033 |
5000033 |
6.17% |
6.17 |
6.16 |
6.16498 |
1.23 |
1.2329878622801 |
$811,038 |
811037.99201295 |
|
 Bret Saberhagen
 |
Saberhagen Bret |
DNP |
$4,500,000 |
4500000 |
5.56% |
5.56 |
— |
0.00 |
— |
0 |
— |
0 |
|
 Tim Wakefield
 |
Wakefield Tim |
RP |
$4,500,000 |
4500000 |
5.56% |
5.56 |
1.28 |
1.28244 |
0.28 |
0.28498666666667 |
$3,508,936 |
3508936.0905773 |
|
 Troy O'Leary
 |
O'Leary Troy |
LF |
$4,000,000 |
4000000 |
4.94% |
4.94 |
1.31 |
1.30762 |
0.33 |
0.326905 |
$3,058,993 |
3058992.6737125 |
|
 Mike Stanley
 |
Stanley Mike |
1B |
$4,000,000 |
4000000 |
4.94% |
4.94 |
0.78 |
0.779694 |
0.19 |
0.1949235 |
$5,130,218 |
5130217.7520925 |
|
 Tom Gordon
 |
Gordon Tom |
DNP |
$3,750,000 |
3750000 |
4.63% |
4.63 |
— |
0.00 |
— |
0 |
— |
0 |
|
 Nomar Garciaparra
 |
Garciaparra Nomar |
SS |
$3,700,000 |
3700000 |
4.57% |
4.57 |
10.15 |
10.1477 |
2.74 |
2.7426216216216 |
$364,615 |
364614.64174148 |
|
 Rod Beck
 |
Beck Rod |
RP |
$3,500,000 |
3500000 |
4.32% |
4.32 |
1.03 |
1.02842 |
0.29 |
0.29383428571429 |
$3,403,279 |
3403278.8160479 |
|
 Jeff Frye
 |
Frye Jeff |
2B |
$2,500,000 |
2500000 |
3.09% |
3.09 |
0.78 |
0.780839 |
0.31 |
0.3123356 |
$3,201,684 |
3201684.3420987 |
|
 Darren Lewis
 |
Lewis Darren |
CF |
$2,400,000 |
2400000 |
2.96% |
2.96 |
0.12 |
0.121957 |
0.05 |
0.050815416666667 |
$19,679,067 |
19679067.212214 |
|
 Jeff Fassero
 |
Fassero Jeff |
RP |
$2,000,000 |
2000000 |
2.47% |
2.47 |
2.31 |
2.30504 |
1.15 |
1.15252 |
$867,664 |
867663.90171103 |
|
 Rheal Cormier
 |
Cormier Rheal |
RP |
$2,000,000 |
2000000 |
2.47% |
2.47 |
0.60 |
0.598624 |
0.30 |
0.299312 |
$3,340,995 |
3340995.3493345 |
|
 Bryce Florie
 |
Florie Bryce |
RP |
$1,350,000 |
1350000 |
1.67% |
1.67 |
0.41 |
0.413156 |
0.31 |
0.30604148148148 |
$3,267,531 |
3267530.908422 |
|
 Scott Hatteberg
 |
Hatteberg Scott |
C |
$695,000 |
695000 |
0.86% |
0.86 |
1.36 |
1.36234 |
1.96 |
1.9602014388489 |
$510,152 |
510151.65083606 |
|
 John Wasdin
 |
Wasdin John |
RP |
$625,000 |
625000 |
0.77% |
0.77 |
1.05 |
1.05247 |
1.68 |
1.683952 |
$593,841 |
593841.15461723 |
|
 Derek Lowe
 |
Lowe Derek |
RP |
$625,000 |
625000 |
0.77% |
0.77 |
2.57 |
2.56753 |
4.11 |
4.108048 |
$243,425 |
243424.61431804 |
|
 Manny Alexander
 |
Alexander Manny |
3B |
$612,500 |
612500 |
0.76% |
0.76 |
-0.17 |
-0.173161 |
— |
0 |
— |
0 |
|
 Rich Garces
 |
Garces Rich |
RP |
$610,000 |
610000 |
0.75% |
0.75 |
1.75 |
1.75009 |
2.87 |
2.869 |
$348,554 |
348553.5029627 |
|
 Jason Varitek
 |
Varitek Jason |
C |
$375,000 |
375000 |
0.46% |
0.46 |
4.03 |
4.0273 |
10.74 |
10.739466666667 |
$93,114 |
93114.493581308 |
|
 Gary Gaetti
 |
Gaetti Gary |
DH |
$350,000 |
350000 |
0.43% |
0.43 |
-0.29 |
-0.285131 |
— |
0 |
— |
0 |
|
 Brian Daubach
 |
Daubach Brian |
1B |
$295,000 |
295000 |
0.36% |
0.36 |
0.95 |
0.947071 |
3.21 |
3.2104101694915 |
$311,487 |
311486.67840109 |
|
 Trot Nixon
 |
Nixon Trot |
RF |
$270,000 |
270000 |
0.33% |
0.33 |
3.25 |
3.25148 |
12.04 |
12.042518518519 |
$83,039 |
83039.108344508 |
|
 Michael Tejera
 |
Tejera Michael |
DNP |
$201,000 |
201000 |
0.25% |
0.25 |
— |
0.00 |
— |
0 |
— |
0 |
|
 Pete Schourek
 |
Schourek Pete |
RP |
$200,000 |
200000 |
0.25% |
0.25 |
0.65 |
0.652421 |
3.26 |
3.262105 |
$306,551 |
306550.52489114 |
|
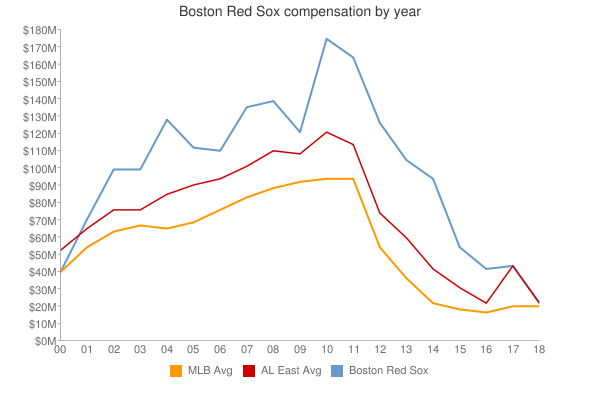
| Year | Red Sox payroll |
PR Sort |
Avg payroll |
AvgPR Sort |
Diff |
Diff Sort |
|---|
| 1997 | $1,100,000 | 1100000 | $4,753,000 | 4753000 | $-3,653,000 | -3653000 |
| 1998 | $9,100,000 | 9100000 | $6,661,904 | 6661904 | $2,438,096 | 2438096 |
| 1999 | $14,500,000 | 14500000 | $7,867,823 | 7867823 | $6,632,177 | 6632177 |
| 2000 | $80,978,533 | 80978533 | $55,368,142 | 55368142 | $25,610,391 | 25610391 |
| 2001 | $111,488,333 | 111488333 | $64,937,084 | 64937084 | $46,551,249 | 46551249 |
| 2002 | $108,645,000 | 108645000 | $67,238,672 | 67238672 | $41,406,328 | 41406328 |
| 2003 | $99,251,500 | 99251500 | $70,654,480 | 70654480 | $28,597,020 | 28597020 |
| 2004 | $128,545,500 | 128545500 | $69,466,729 | 69466729 | $59,078,771 | 59078771 |
| 2005 | $125,097,825 | 125097825 | $74,114,841 | 74114841 | $50,982,984 | 50982984 |
| 2006 | $124,406,500 | 124406500 | $79,621,815 | 79621815 | $44,784,685 | 44784685 |
| 2007 | $147,568,833 | 147568833 | $85,537,470 | 85537470 | $62,031,363 | 62031363 |
| 2008 | $136,798,083 | 136798083 | $92,003,799 | 92003799 | $44,794,284 | 44794284 |
| 2009 | $122,803,640 | 122803640 | $92,169,598 | 92169598 | $30,634,042 | 30634042 |
| 2010 | $173,759,833 | 173759833 | $94,342,601 | 94342601 | $79,417,232 | 79417232 |
| 2011 | $165,828,976 | 165828976 | $96,974,710 | 96974710 | $68,854,266 | 68854266 |
| 2012 | $175,205,284 | 175205284 | $100,947,217 | 100947217 | $74,258,067 | 74258067 |
| 2013 | $150,655,000 | 150655000 | $108,586,966 | 108586966 | $42,068,034 | 42068034 |
| 2014 | $163,414,996 | 163414996 | $117,131,361 | 117131361 | $46,283,635 | 46283635 |
| 2015 | $180,779,329 | 180779329 | $126,168,161 | 126168161 | $54,611,168 | 54611168 |
| 2016 | $197,899,679 | 197899679 | $131,756,569 | 131756569 | $66,143,110 | 66143110 |
| 2017 | $197,041,179 | 197041179 | $136,337,445 | 136337445 | $60,703,734 | 60703734 |
| 2018 | $233,200,428 | 233200428 | $135,360,600 | 135360600 | $97,839,828 | 97839828 |
| 2019 | $236,171,428 | 236171428 | $134,792,134 | 134792134 | $101,379,294 | 101379294 |
| 2020 | $187,907,969 | 187907969 | $139,496,467 | 139496467 | $48,411,502 | 48411502 |
| 2021 | $176,099,500 | 176099500 | $130,712,288 | 130712288 | $45,387,212 | 45387212 |
| 2022 | $212,015,000 | 212015000 | $149,802,695 | 149802695 | $62,212,305 | 62212305 |
| 2023 | $154,435,000 | 154435000 | $161,692,345 | 161692345 | $-7,257,345 | -7257345 |
| 2024 | $97,266,667 | 97266667 | $136,306,249 | 136306249 | $-39,039,582 | -39039582 |
| 2025 | $86,566,667 | 86566667 | $98,329,527 | 98329527 | $-11,762,860 | -11762860 |
| 2026 | $73,916,667 | 73916667 | $78,039,273 | 78039273 | $-4,122,606 | -4122606 |
| 2027 | $71,416,667 | 71416667 | $60,919,343 | 60919343 | $10,497,324 | 10497324 |
| 2028 | $59,916,667 | 59916667 | $46,901,712 | 46901712 | $13,014,955 | 13014955 |
| 2029 | $59,916,667 | 59916667 | $38,597,944 | 38597944 | $21,318,723 | 21318723 |
| 2030 | $44,750,000 | 44750000 | $41,447,579 | 41447579 | $3,302,421 | 3302421 |
| 2031 | $44,000,000 | 44000000 | $38,360,152 | 38360152 | $5,639,848 | 5639848 |
| 2032 | $35,000,000 | 35000000 | $47,925,459 | 47925459 | $-12,925,459 | -12925459 |
| 2033 | $31,000,000 | 31000000 | $43,068,924 | 43068924 | $-12,068,924 | -12068924 |
|
 2000 Boston Red Sox