| Player | Player Sort | Pos | Salary | Salary Sort | Pct | Pct Sort | WARP | WARP Sort | WARP/$M | WARP/$M Sort | $/WARP | $/WARP Sort | Current Status |
|---|
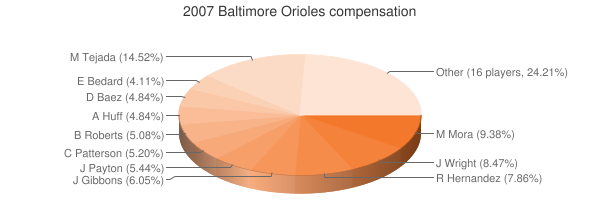
 Miguel Tejada
 |
Tejada Miguel |
SS |
$14,000,000 |
14000000 |
14.88% |
14.88 |
1.77 |
1.76882 |
0.13 |
0.12634428571429 |
$7,914,881 |
7914881.1071788 |
|
 Melvin Mora
 |
Mora Melvin |
3B |
$7,758,503 |
7758503 |
8.25% |
8.25 |
2.73 |
2.73495 |
0.35 |
0.3525100138519 |
$2,836,799 |
2836798.8445858 |
|
 Kris Benson
 |
Benson Kris |
DNP |
$7,144,556 |
7144556 |
7.60% |
7.60 |
— |
0.00 |
— |
0 |
— |
0 |
|
 Jaret Wright
 |
Wright Jaret |
RP |
$7,000,000 |
7000000 |
7.44% |
7.44 |
-0.10 |
-0.0997632 |
— |
0 |
— |
0 |
|
 Ramon Hernandez
 |
Hernandez Ramon |
C |
$6,500,000 |
6500000 |
6.91% |
6.91 |
-0.67 |
-0.673244 |
— |
0 |
— |
0 |
|
 Danys Baez
 |
Baez Danys |
RP |
$5,666,667 |
5666667 |
6.02% |
6.02 |
-1.22 |
-1.22065 |
— |
0 |
— |
0 |
|
 Jay Gibbons
 |
Gibbons Jay |
LF |
$5,000,000 |
5000000 |
5.32% |
5.32 |
-0.86 |
-0.856846 |
— |
0 |
— |
0 |
|
 Jay Payton
 |
Payton Jay |
LF |
$4,500,000 |
4500000 |
4.78% |
4.78 |
1.07 |
1.06568 |
0.24 |
0.23681777777778 |
$4,222,656 |
4222655.95676 |
|
 Corey Patterson
 |
Patterson Corey |
CF |
$4,300,000 |
4300000 |
4.57% |
4.57 |
-0.52 |
-0.523855 |
— |
0 |
— |
0 |
|
 Brian Roberts
 |
Roberts Brian |
2B |
$4,200,000 |
4200000 |
4.47% |
4.47 |
4.72 |
4.72309 |
1.12 |
1.1245452380952 |
$889,248 |
889248.35224398 |
|
 Aubrey Huff
 |
Huff Aubrey |
DH |
$4,000,000 |
4000000 |
4.25% |
4.25 |
0.89 |
0.893146 |
0.22 |
0.2232865 |
$4,478,551 |
4478551.0991484 |
|
 Erik Bedard
 |
Bedard Erik |
RP |
$3,400,000 |
3400000 |
3.61% |
3.61 |
7.03 |
7.03359 |
2.07 |
2.0687029411765 |
$483,395 |
483394.68180545 |
|
 Steve Trachsel
 |
Trachsel Steve |
RP |
$3,100,000 |
3100000 |
3.30% |
3.30 |
-3.44 |
-3.43843 |
— |
0 |
— |
0 |
|
 Jamie Walker
 |
Walker Jamie |
RP |
$3,000,000 |
3000000 |
3.19% |
3.19 |
-0.15 |
-0.151599 |
— |
0 |
— |
0 |
|
 Chad Bradford
 |
Bradford Chad |
RP |
$3,000,000 |
3000000 |
3.19% |
3.19 |
0.55 |
0.546715 |
0.18 |
0.18223833333333 |
$5,487,320 |
5487319.7186834 |
|
 Kevin Millar
 |
Millar Kevin |
1B |
$2,750,000 |
2750000 |
2.92% |
2.92 |
1.20 |
1.20476 |
0.44 |
0.43809454545455 |
$2,282,612 |
2282612.3045254 |
|
 Daniel Cabrera
 |
Cabrera Daniel |
RP |
$1,825,000 |
1825000 |
1.94% |
1.94 |
0.26 |
0.257877 |
0.14 |
0.14130246575342 |
$7,077,017 |
7077017.337723 |
|
 Adam Loewen
 |
Loewen Adam |
RP |
$967,000 |
967000 |
1.03% |
1.03 |
-0.63 |
-0.630948 |
— |
0 |
— |
0 |
|
 Paul Bako
 |
Bako Paul |
C |
$900,000 |
900000 |
0.96% |
0.96 |
-0.88 |
-0.881279 |
— |
0 |
— |
0 |
|
 Scott Williamson
 |
Williamson Scott |
RP |
$900,000 |
900000 |
0.96% |
0.96 |
0.33 |
0.333915 |
0.37 |
0.37101666666667 |
$2,695,297 |
2695296.7072459 |
|
 Chris Gomez
 |
Gomez Chris |
1B |
$850,000 |
850000 |
0.90% |
0.90 |
0.54 |
0.543004 |
0.64 |
0.63882823529412 |
$1,565,366 |
1565366.0009871 |
|
 John Parrish
 |
Parrish John |
RP |
$575,000 |
575000 |
0.61% |
0.61 |
-0.63 |
-0.628846 |
— |
0 |
— |
0 |
|
 Chris Ray
 |
Ray Chris |
RP |
$420,000 |
420000 |
0.45% |
0.45 |
1.04 |
1.0424 |
2.48 |
2.4819047619048 |
$402,916 |
402916.34689179 |
|
 Nick Markakis
 |
Markakis Nick |
RF |
$400,000 |
400000 |
0.43% |
0.43 |
3.38 |
3.37655 |
8.44 |
8.441375 |
$118,464 |
118464.11277784 |
|
 Brian Burres
 |
Burres Brian |
RP |
$380,000 |
380000 |
0.40% |
0.40 |
-1.48 |
-1.48173 |
— |
0 |
— |
0 |
|
 Jeremy Guthrie
 |
Guthrie Jeremy |
RP |
$380,000 |
380000 |
0.40% |
0.40 |
2.23 |
2.22742 |
5.86 |
5.8616315789474 |
$170,601 |
170600.9643444 |
|
 Michael Aubrey
 |
Aubrey Michael |
DNP |
$380,000 |
380000 |
0.40% |
0.40 |
— |
0.00 |
— |
0 |
— |
0 |
|
 Sendy Rleal
 |
Rleal Sendy |
DNP |
$380,000 |
380000 |
0.40% |
0.40 |
— |
0.00 |
— |
0 |
— |
0 |
|
 Freddie Bynum
 |
Bynum Freddie |
PR |
$380,000 |
380000 |
0.40% |
0.40 |
0.07 |
0.0701619 |
0.18 |
0.18463657894737 |
$5,416,045 |
5416044.8904605 |
|
| Year | Orioles payroll |
PR Sort |
Avg payroll |
AvgPR Sort |
Diff |
Diff Sort |
|---|
| 2000 | $82,250,111 | 82250111 | $56,164,089 | 56164089 | $26,086,022 | 26086022 |
| 2001 | $73,894,540 | 73894540 | $65,991,638 | 65991638 | $7,902,902 | 7902902 |
| 2002 | $60,496,987 | 60496987 | $68,244,471 | 68244471 | $-7,747,484 | -7747484 |
| 2003 | $73,282,500 | 73282500 | $71,318,479 | 71318479 | $1,964,021 | 1964021 |
| 2004 | $53,273,333 | 53273333 | $70,466,961 | 70466961 | $-17,193,628 | -17193628 |
| 2005 | $73,066,833 | 73066833 | $73,264,780 | 73264780 | $-197,947 | -197947 |
| 2006 | $83,729,266 | 83729266 | $79,051,754 | 79051754 | $4,677,512 | 4677512 |
| 2007 | $94,056,726 | 94056726 | $83,931,138 | 83931138 | $10,125,588 | 10125588 |
| 2008 | $66,644,581 | 66644581 | $90,812,373 | 90812373 | $-24,167,792 | -24167792 |
| 2009 | $68,369,792 | 68369792 | $91,093,211 | 91093211 | $-22,723,419 | -22723419 |
| 2010 | $75,412,500 | 75412500 | $93,373,681 | 93373681 | $-17,961,181 | -17961181 |
| 2011 | $88,184,250 | 88184250 | $96,102,034 | 96102034 | $-7,917,784 | -7917784 |
| 2012 | $84,769,000 | 84769000 | $100,657,138 | 100657138 | $-15,888,138 | -15888138 |
| 2013 | $92,238,334 | 92238334 | $109,024,990 | 109024990 | $-16,786,656 | -16786656 |
| 2014 | $107,976,154 | 107976154 | $117,828,782 | 117828782 | $-9,852,628 | -9852628 |
| 2015 | $118,975,833 | 118975833 | $127,404,244 | 127404244 | $-8,428,411 | -8428411 |
| 2016 | $147,693,714 | 147693714 | $132,219,407 | 132219407 | $15,474,307 | 15474307 |
| 2017 | $164,326,172 | 164326172 | $137,302,894 | 137302894 | $27,023,278 | 27023278 |
| 2018 | $148,574,615 | 148574615 | $136,929,168 | 136929168 | $11,645,447 | 11645447 |
| 2019 | $80,814,882 | 80814882 | $136,944,257 | 136944257 | $-56,129,375 | -56129375 |
| 2020 | $62,285,088 | 62285088 | $140,677,788 | 140677788 | $-78,392,700 | -78392700 |
| 2021 | $62,525,283 | 62525283 | $132,162,631 | 132162631 | $-69,637,348 | -69637348 |
| 2022 | $43,068,167 | 43068167 | $149,374,046 | 149374046 | $-106,305,879 | -106305879 |
| 2023 | $66,889,067 | 66889067 | $160,460,390 | 160460390 | $-93,571,323 | -93571323 |
| 2024 | $52,645,666 | 52645666 | $135,504,022 | 135504022 | $-82,858,356 | -82858356 |
| 2025 | $2,000,000 | 2000000 | $96,417,302 | 96417302 | $-94,417,302 | -94417302 |
|
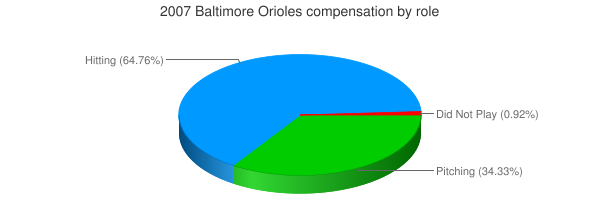
 2007 Baltimore Orioles