Last week’s column brought some comments wondering if there
were other factors contributing to the rise in attendance that were missed. Barry Reed asked if something as simple as the increase in population over time
held responsibility for most of the rise seen. By way of an answer, the next chart shows the relationship between the US population and average attendance per game–note that census figures are published every decade. I extrapolated the years in between linearly (click the graph for a larger image):
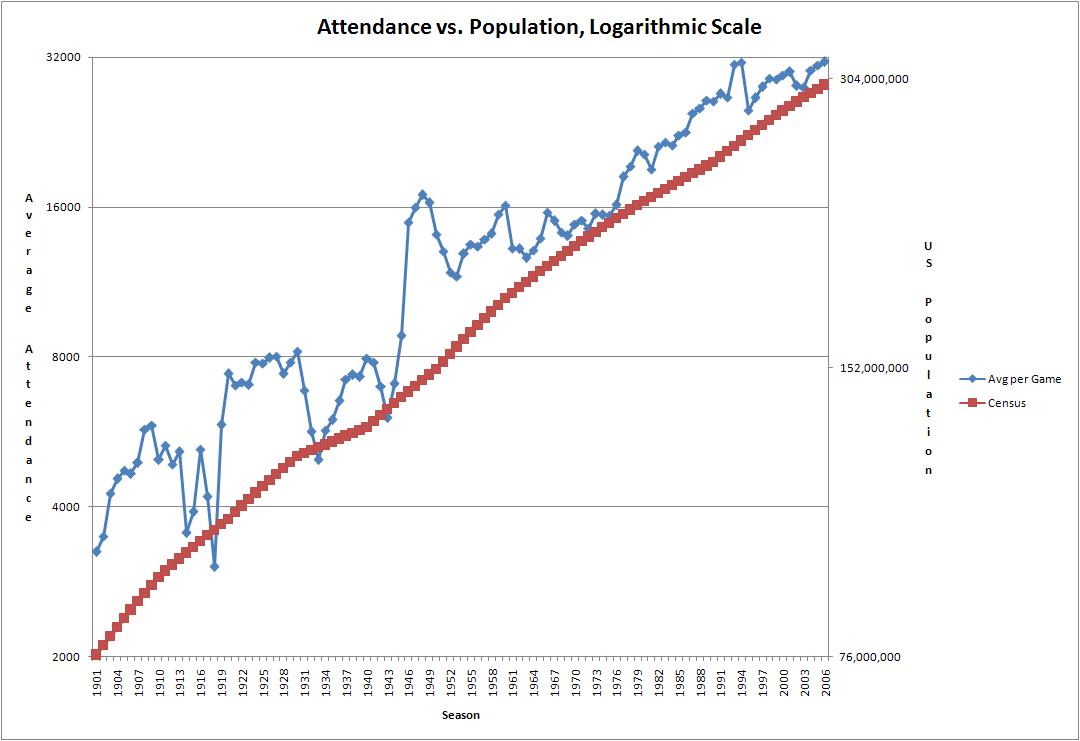
The Y-axes are scaled logarithmically using a base of two. This shows doubling
time nicely, as each equally-spaced height denotes a doubling of attendance or
population. The first thing to notice about the graph is that while the United
States population quadrupled over the time period in question, the average
attendance per game increased eight times. That is, every two people
added to the population of the country created four baseball fans. If you want to take a big leap of faith and assume that this is an immutable law of nature, perhaps MLB should start running ads that encourage citizens to produce lots and lots of children.
More interesting, however, is the clear indication that over certain periods of
time population growth had little to do with attendance growth. The number of
fans willing to buy a ticket shot up in 1946, but stayed pretty steady until
1975, despite a baby boom. There was also a good rise in attendance during the
1930s, despite slowed population growth.
Since 1976, population and attendance appear to be more in tune, but the rate of
growth in attendance remains twice as fast as the rate for the increase in
population. While a large citizenry means more potential customers, population
growth alone does not explain the attendance boom.
Jeff Kissel proposed that night baseball played a factor:
I think you may have ignored arguably the biggest impact on baseball attendance over the past 50-100 years: the elimination of the majority of weekday afternoon games. Perhaps a study correlating the percentage of night games played versus overall attendance would more clearly show the change brought on by the advent of night baseball.
To check this out, we’re fortunate that Retrosheet provides game logs with day/night designations going back to 1959. The next graph compares average attendance per game and percentage of night games played, along with a five-year moving average for each (click the graph for a larger image):
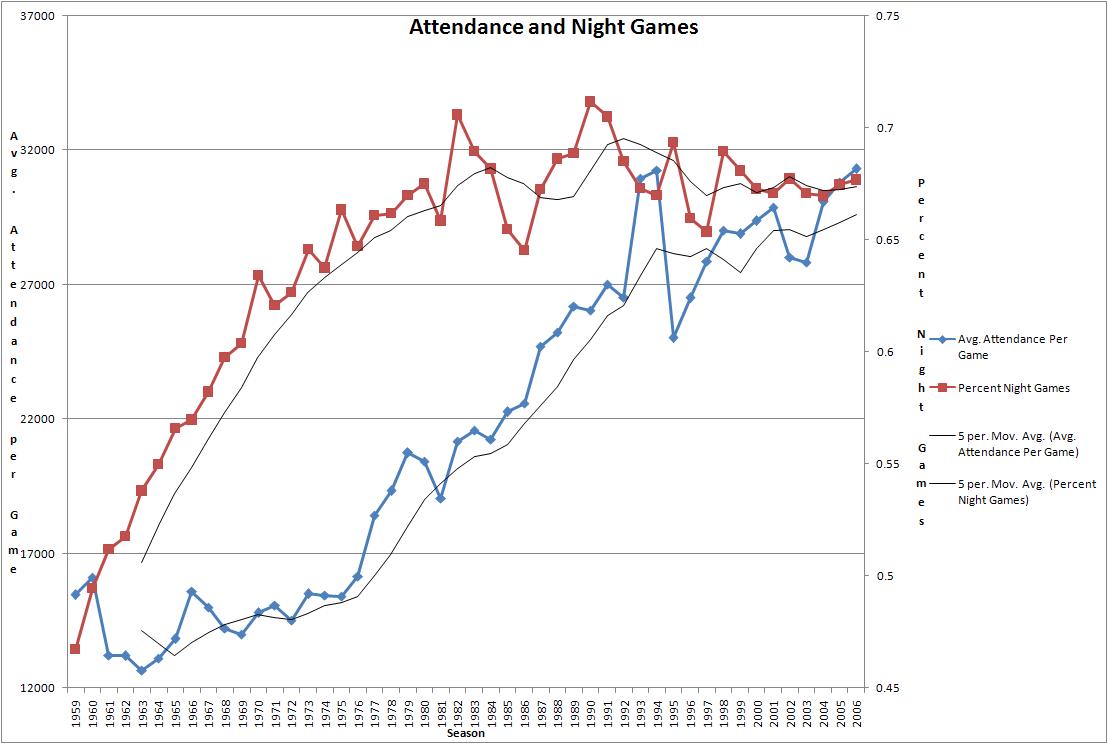
From 1959 to 1975, the percentage of games played under the lights increased
steadily. Meanwhile, attendance growth stagnated. Note also that after night
games reached a high point in 1982, attendance rose as teams scaled back the
number of games under the lights. After about twenty years of experimentation
(from 1980 to 2000), it appears that major league baseball settled on 67 percent night games as the optimum level. However, games played later in the day by themselves did little to increase attendance. This is a somewhat surprising conclusion–the prevalance of games at times when fewer people work should be a net win. My guess, however, is that night games do more to increase the television and radio audiences. We’ll test that hypothesis in a later column.
One commenter on my blog, Baseball Musings, leaves apocalyptic comments to posts
whenever runs per game decline. He warns of falling fan support if low-scoring games become more numerous, and while he tends to overreact, the
point is one well worth exploring–do more fans buy tickets when scoring rises? Once again, a visual aide (click the graph for a larger image):
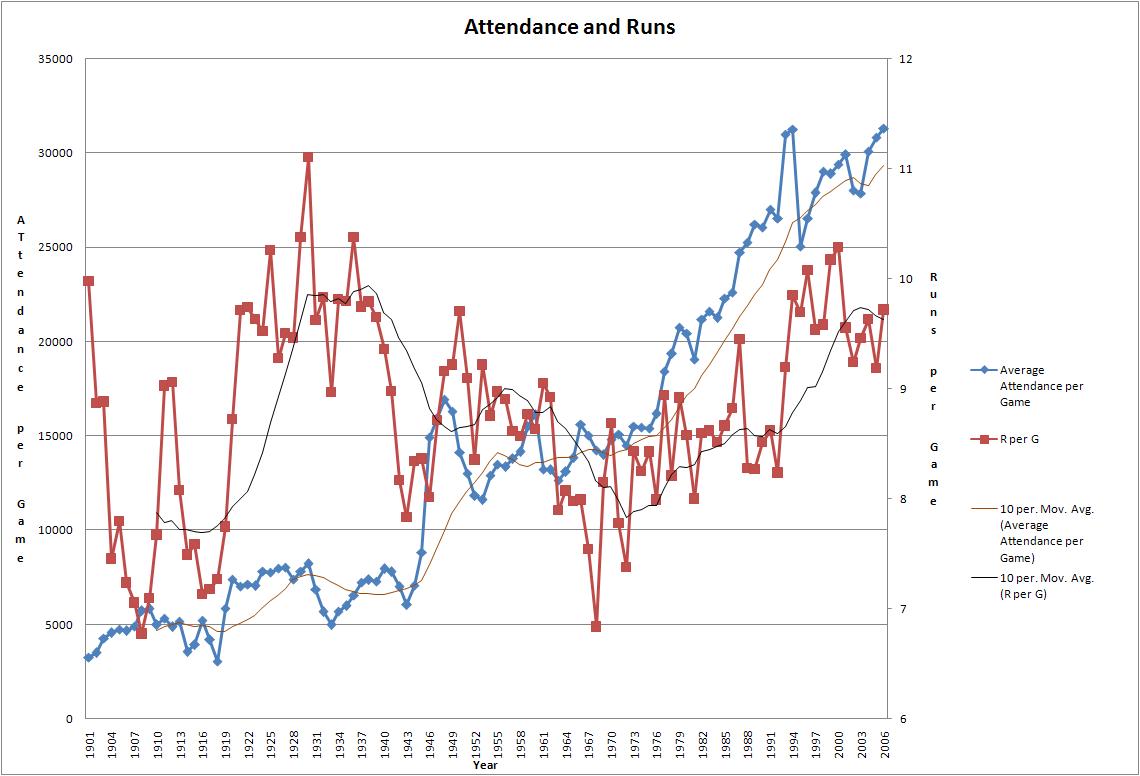
This hypothesis holds up better than the earlier two. The offensive surge from
1918 to 1921 is matched by a nice upswing in attendance. Runs remain steady
after that (although there’s plenty of year-to-year volatility), and so does
attendance. There are plenty of anomalies, however. For example, from 1938 to 1941, offense falls, yet attendance ekes up a bit. The 1950s and 1960s also
work against this idea in a more long-term way. Attendance stays steady when you
look at the ten-year trend line, but offense (in terms of runs) falls during
this period. Even here, however, there is some similar movement. The Year of the Pitcher, 1968, represents a sixty-year low in offense and a local low in attendance. The current upswing in attendance started about 17 years before the big upswing in runs.
Looking at common movements, the change in runs and attendance from one year to another move in the same direction 58% of the time–that’s close to random. Still, the relationship between scoring and popularity need to be explored further. Does an optimum level of runs per game exist that strikes the proper balance between offense and defense? That will be the subject a future column.
None of these hypotheses dissuade me from the idea that a dynamic game keeps the
fans interested and brings new people to baseball. Attendance over a one -hundred year period has grown much faster than the population. An increase in night games didn’t add any extra fannies to the seats, and too many night games actually seemed to affect attendance negatively. There’s some relationship between offense and ticket sales, but it’s not as simple as a proposition that more runs means more fans. Something happened in 1976 to change the way fans responded to the game, and free agency remains the most obvious catalyst.
Thank you for reading
This is a free article. If you enjoyed it, consider subscribing to Baseball Prospectus. Subscriptions support ongoing public baseball research and analysis in an increasingly proprietary environment.
Subscribe now