One of the entertaining elements to following the Cubs this year is witnessing just how the city’s reactions have changed in light of the lofty expectations foisted on the team prior to the start of the season. Ordinarily, a 30-28 record during the first 90-degree week of the summer (note to self: when scouting apartments, “central air” deserves higher priority than “hardwood floors”) would be cause for celebration. This time around, it has triggered grave concern, as the red-on-blue Cub flag flies feebly beneath those of the Reds, Cards and Astros atop the center field scoreboard at Wrigley.
Never mind that such a record is perfectly in line with expectations considering that the team has been without Mark Prior for nine weeks, Kerry Wood for five and counting, and Sammy Sosa for four. The Cubs, for the first time in recent memory, were supposed to win, and win big, and their inability to do so has prompted a series of rash and irrational explanations ranging from the lingering aftereffects of the Steve Bartman curse to the bad karma engendered by attempting to field an expensive, free-agent laden team in Cubbie pinstripes. (It is worth pausing to note that Baseball Prospectus supports unequivocally the tough and subversively sabermetric love accorded to Corey “Shawon” Patterson, who after having being booed heavily over the past couple of weeks, received a hearty and apparently non-sarcastic cheer following his third inning at-bat on Tuesday night. Corey took five pitches from Woody Williams in the same at bat–three balls and two called strikes–running the count full. He then lined out to second base.)
One of the problems, it seems, is not that the Cubs aren’t scoring enough runs–the team is on pace to score about 760 times this season, more than PECOTA anticipated and more than they should need given their pitching–but that they aren’t scoring them at the right times. The Cubs score runs in bunches–they’ve scored seven or more runs in a game on 18 occasions, but two or fewer 15 times. It has been speculated that this inconsistency is the result of a power-heavy offense (the Cubs are outranked by only the Rockies in home run hitting) that tees off on the Jimmy Hayneses of the league, while flailing against the Roy Oswalts.
Provided that a team scores enough runs to be a playoff contender, consistency is a desired characteristic–you’d rather score five runs every time out than, say, eight in half of your games and two in the other half. That’s especially true for a team that gets more than its share of quality starts; the Cubs are 25-6 this season when scoring four or more runs. Indeed, as measured by the standard deviation of their per-game run output, the Cubs offense has been inconsistent. The standard deviation on their run scoring this season is 3.36, whereas an “average” team at their level of offensive output should have a standard deviation of about 3.15. (The difference is not statistically significant).
What isn’t clear is that the inconsistency of the Cubs offense, purported or real, has much of anything to do with its power-heavy composition. Contact offenses, power offenses, plate discipline offenses, speed-and-sacrifice offenses–all of these offenses are subject to about the same degree of inconsistency in their run scoring output.
I looked at game logs for each major league team since 1999 in order to pull together two simple points of data–their average run output per game, and the standard deviation on their run output per game. Unsurprisingly, the two metrics are correlated:
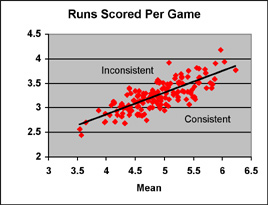
In fact, the mean and standard deviation on run scoring are very strongly correlated–the correlation coefficient is .78. A strong offense is going to have more variance in its run output than a weaker one, simply because it has got more runs to distribute between different games. It would be misleading to describe such an offense as “inconsistent”.
Rather, the mark of a consistent offense is that it has a low standard deviation on its run scoring relative to its overall level of offensive output. In the graph above, these teams are the ones below and to the right of the black, best-fit regression line that bisects the chart. The inconsistent teams, which have a larger variance than you’d expect given their run scoring, are above and to the left of the line.
Below, I’ve prepared a table listing the most consistent offenses since 1999. For each team, the following categories are listed:
- Average runs scored per game.
- Standard deviation of runs scored per game.
- “Expected” standard deviation of runs scored per game based on average runs scored, as determined via regression analysis.
- Difference (“Delta”) between actual and expected standard deviation. A positive Delta indicates a consistent offense; a negative delta, an inconsistent one.
- “Bias”–an indication of the team’s relative offensive strength. For example, a team that ranks much higher in home runs than it does in batting average or walk rate is listed as a “SLG” team.
Table 1: Consistent Offenses

                       St. Dev  St. Dev   St. Dev
Team   Year  Avg. RPG  Actual   Expected  Delta     Bias
----------------------------------------------------------
KCA    2000    5.43     3.06    3.48      0.42      BA
SFN    2003    4.69     2.74    3.16      0.41      OBP
CLE    2001    5.54     3.17    3.53      0.36      Balanced
ATL    2000    5.00     2.95    3.29      0.35      BA
CLE    2003    4.31     2.68    2.99      0.31      Balanced
TOR    2003    5.52     3.22    3.52      0.30      Balanced
MIN    2000    4.62     2.83    3.12      0.29      BA
TEX    2001    5.49     3.22    3.51      0.29      SLG
SFN    1999    5.38     3.18    3.46      0.29      OBP
CIN    2000    5.06     3.04    3.32      0.28      SLG
The most consistent offense of the past five years was that belonging to the 2000 Kansas City Royals. That Royals team, managed by Tony Muser, was an interesting bunch, ranking first in the league in batting average, first in avoiding strikeouts, and third in stolen bases, but thirteenth in walks drawn, and dead last in home runs. They were, in short, poster children for the theory that offenses that don’t rely on walks and power are going to produce more consistent results.
But take a look at the team just beneath them: last year’s San Francisco Giants. That team ranked third in the league in walks, dead last in stolen bases, and relied mostly upon a strategy of sitting back and waiting for Barry Bonds to come to the plate again. Hardly the sort of scratch-and-claw team that the Royals represented, yet the Giants produced runs with remarkable consistency. The 2001 Texas Rangers hit 246 home runs, but had no trouble with their variance. All types and kinds of offenses are represented on that chart.
Similarly, inconsistent offenses come in all shapes and sizes:
Table 2: Inconsistent Offenses

                       St. Dev  St. Dev   St. Dev
Team   Year  Avg. RPG  Actual   Expected  Delta     Bias
----------------------------------------------------------
DET    2000    5.08    3.92     3.33      -0.59     Balanced
COL    2000    5.98    4.17     3.73      -0.45     BA
ANA    1999    4.39    3.40     3.02      -0.37     Balanced
LAN    2002    4.40    3.39     3.03      -0.36     BA
PHI    2003    4.88    3.58     3.24      -0.34     OBP
BAL    2000    4.90    3.56     3.25      -0.31     Balanced
SDN    2001    4.87    3.52     3.24      -0.29     OBP
NYA    2000    5.41    3.76     3.48      -0.28     Balanced
PHI    1999    5.19    3.66     3.38      -0.28     BA
CHA    2002    5.28    3.70     3.42      -0.28     SLG
What do the 2000 Colorado Rockies, the 2003 Philadelphia Phillies, and the 2002 Chicago White Sox have in common? You guessed right–absolutely nothing. The Rockies finished 13th in the National League in home runs in spite of playing in Coors Field, but made up for it by hitting .294 as a club. The Phillies ranked below average in batting average and home runs, but led the lead in walks. The White Sox were a power club first and foremost, smacking 216 home runs and lots of doubles.
This sort of anecdotal evidence won’t be convincing to some of you, but even if we look at the data in a comprehensive fashion, the only clear pattern that emerges is none-at-all. I looked at the Delta score for each of the 150 teams in the dataset, and compared it to their production in five diverse measures of offensive output: batting average, isolated power, walk rate, strikeout rate, and stolen base rate. Here were the correlations between those categories and run consistency Delta:
Table 3: Correlation Between Run Scoring Consistency and Various Offensive Metrics

Batting Average     +.05
Isolated Power      +.02
Walk Rate           -.03
Strikeout Rate      -.03
Stolen Base Rate    +.02
Given that we generally need a correlation coefficient with a magnitude of at least .2 before we can even begin to think about linking causes and effects, it’s clear that there’s nothing of interest going on here at all. For all five metrics, the correlation is zero-point-zero-zero-zero, plus or minus a negligible amount of sample noise. There’s no evidence whatsoever that one “type” of offense is any more or less inclined toward consistency in its run scoring output. Protestations to the contrary are based on a mythological type of Conventional Wisdom that should help a team toward success about as much as blowing up the Bartman Ball. Every offense will have its better days and its poorer days, and some offenses will have an unusually high proportion of them over the course of an entire season, but that’s just one of the many different sorts of luck that affects a team’s fate.
The first rule of offense is: have a good offense. The second rule of offense is: have a good offense. Apologies to Tyler Durden.
Thank you for reading
This is a free article. If you enjoyed it, consider subscribing to Baseball Prospectus. Subscriptions support ongoing public baseball research and analysis in an increasingly proprietary environment.
Subscribe now