The count controls all aspects of the batter-pitcher battle. From pitch type to location to swing tendencies all the way to the batted-ball outcome of a thrown pitch, nothing escapes the influence of the count. Like many statistics in baseball, credit for the count itself is difficult to parse. If a pitcher falls behind in a count, it could be because he is having trouble locating his pitches, or it could be because he is afraid to challenge the hitter in the zone. Conversely, a hitter’s ability to drive into favorable counts could be because of a good eye or a good approach or the ability to inspire a fear of the zone in the opposing pitcher.
I came to the conclusion recently that, because of the pervasive influence of the count, certain plate discipline statistics must be taken with a grain of salt (or an extra grain, if you were already taking them with the pre-recommended grain). I came to this realization because I was examining a certain hitter’s swing rate, and noticed that while his overall swing rate differed little between years, his swing rate on particular counts had changed quite substantially—that is to say, his approach, as a function of the count, had changed. However, when the positive and negative changes in swing rates were averaged, the overall difference in swing rate became muted, concealing the difference in approach.
It is well-known that swing rates differ depending on the count, but by way of introduction, consider this graph, which plots the league-average swing rate (among regulars in 2013) by count.
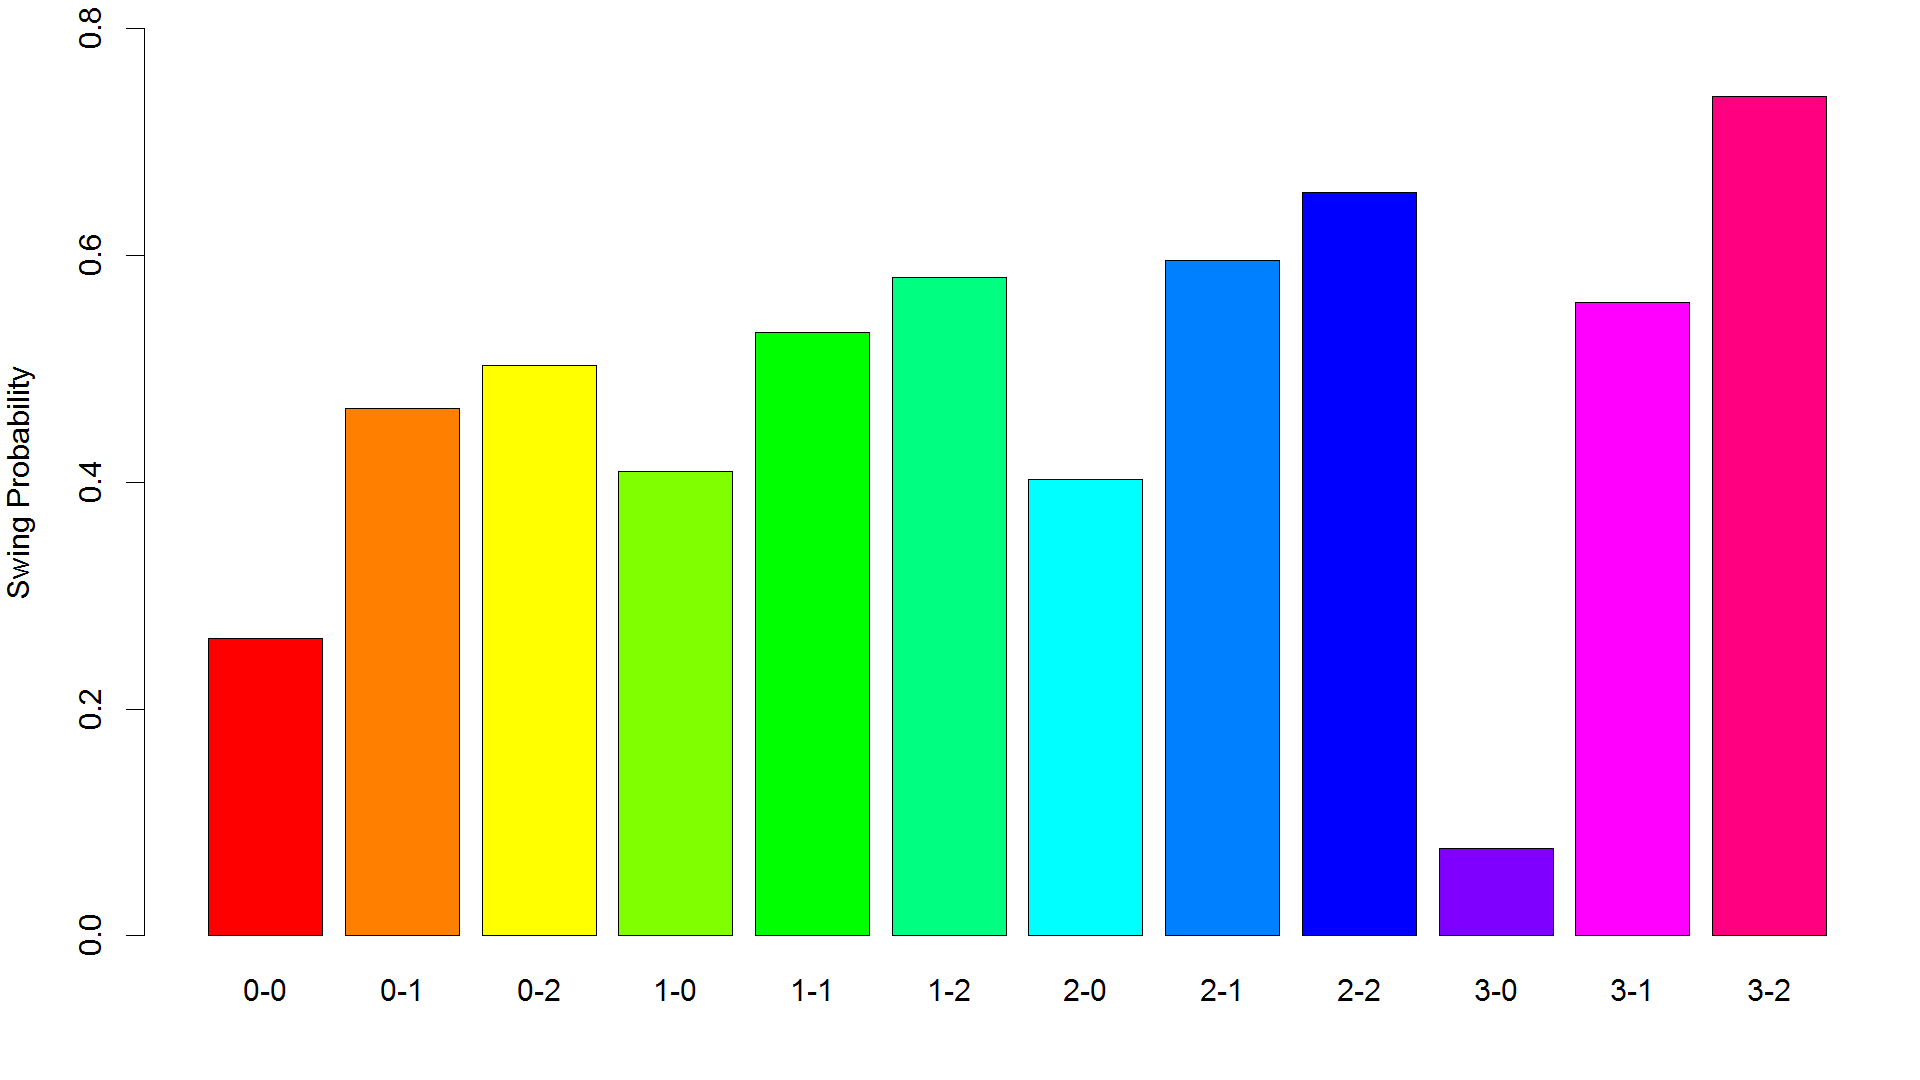
Hitters are generally more liable to swing as they get deeper into counts. The highest swing rate is on 3-2, somewhat surprising, and the lowest is 3-0, unsurprisingly (better to take the near-guaranteed walk). With each strike, swing rate increases massively, perhaps because there is less to lose when a strikeout is imminent.
The above pictures the league-average swing rates by count, however. If we are especially interested in what makes a good approach to the count, one way to examine the question would be to focus in only the best hitters. Consider, therefore, the swing rates of the top 10% (selected by TAv) hitters in baseball.

You don’t see a lot of difference between the swing rates of good hitters and the swing rates of all hitters. It should be possible to accentuate the differences, by comparing the best hitters to the worst hitters (below).

Bad hitters do show a little bit of difference here. To make it really obvious, I plot below the difference in swing rates by count for good vs. bad hitters.
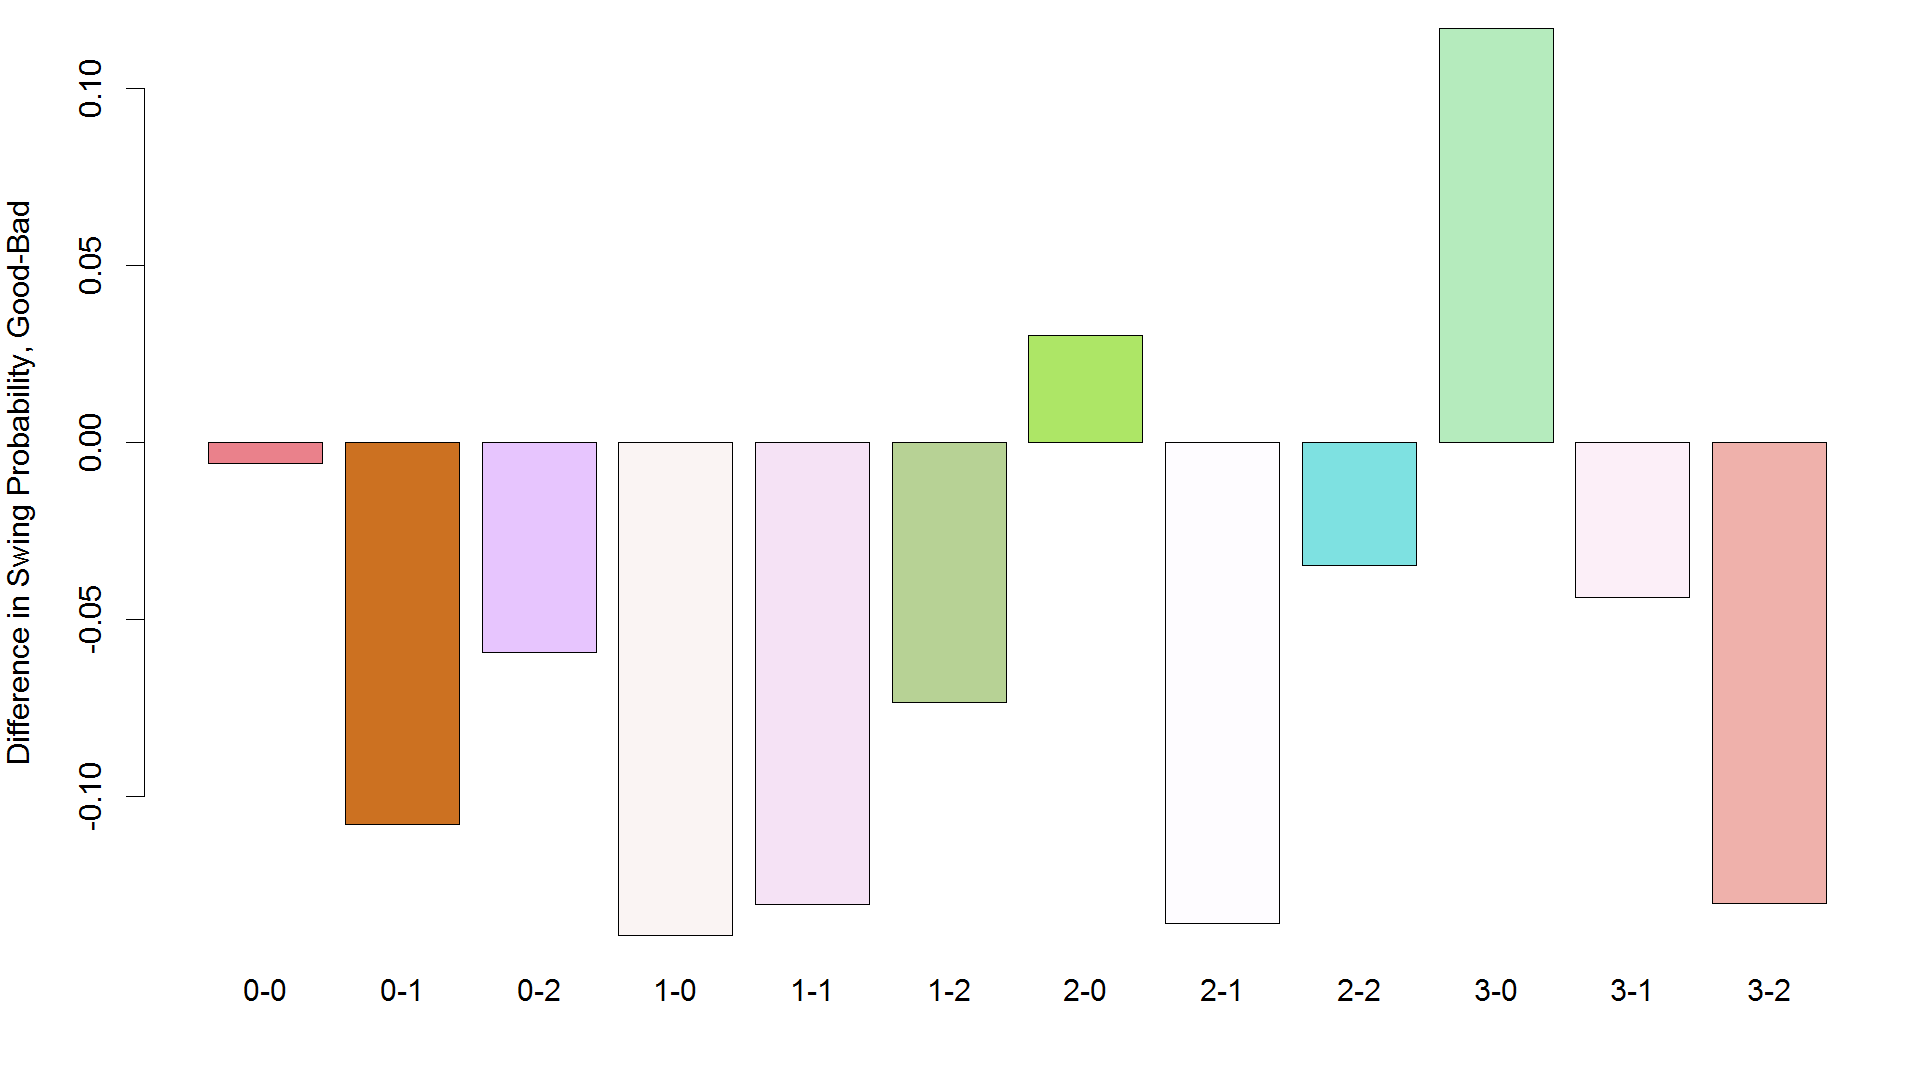
Bars above the line are places where good hitters swing more than bad hitters, and below the line constitutes the reverse situation (where bad hitters swing more than good hitters).
Generally, good hitters swing a lot less than bad hitters. Presumably they are more disciplined, for one thing, but they are also seeing pitches much further from the center of the zone. While receiving pitches two or three feet away from the center of the zone, recognizing a ball from a strike becomes easier.
With that said, the counts in which good hitters swing more stick out all the more obviously. Both 2-0 and 3-0 counts have the biggest positive differences in swing probability. Another interesting—but not positive—difference is at 0-0. Given the overall tendency of good hitters to swing less, the almost negligible difference in swing rates at 0-0 suggests that good hitters might be a little more aggressive early in the count. Maybe these hacking Brewers are onto something.
The 3-0 disparity is especially striking given the controversial nature of that particular count. The controversy revolves around the wisdom or lack thereof at swinging at 3-0 pitches, in view of the fact that such a count is likely to lead to a walk if the hitter simply doesn’t swing. Some coaches advise not swinging, others advise swinging, and still others take positions which vary by the type of hitter and the game situation.
Taken at face value, the above chart would seem to suggest that hitters should swing more at 3-0 pitches; after all, the best hitters do it. However, I will take a contrary position. I think both good and bad hitters are behaving fairly rationally here. A good hitter can do more with a hittable pitch than can a bad hitter; he is more likely to get a hit, and it is more likely that such a hit will be of the extra-base variety, than a poor hitter. In view of this dissimilarity, a walk is more valuable (relative to the possible put-in-play outcomes) to a bad hitter than to a good hitter. Therefore, the bad hitter is justified in pursuing the lower-risk, lower-reward play, and the good hitter is perfectly justified in pursuing the opposite strategy. It may even be the case that good hitters swing more because of a green-light given by their coaches.
Changing Approaches
Having now shown that swing rates are quite variable by the count, I want to show that hitters do actually vary these swing rates by count more than we appreciate. Instead of considering overall swing rates, I contrasted swing rates at each individual count between hitters from 2013-2014. I took the average difference in swing rates by count, weighted by the frequency of each count, as the difference in swing rate. Then I compared that to the overall difference in swing rate, which you can get just by asking how many swings there were per pitch, that is, without considering the count at which those swings took place.
Just as I suspected, hitters varied a lot more in their swing rates by count than they did in their swing rates overall. The average overall difference was a mere 2.2 percentage points, whereas the average count-adjusted swing rate difference was more than double that at 5 percentage points. Moreover, the swing rate differences themselves weren’t always consistent when examining in these different ways.
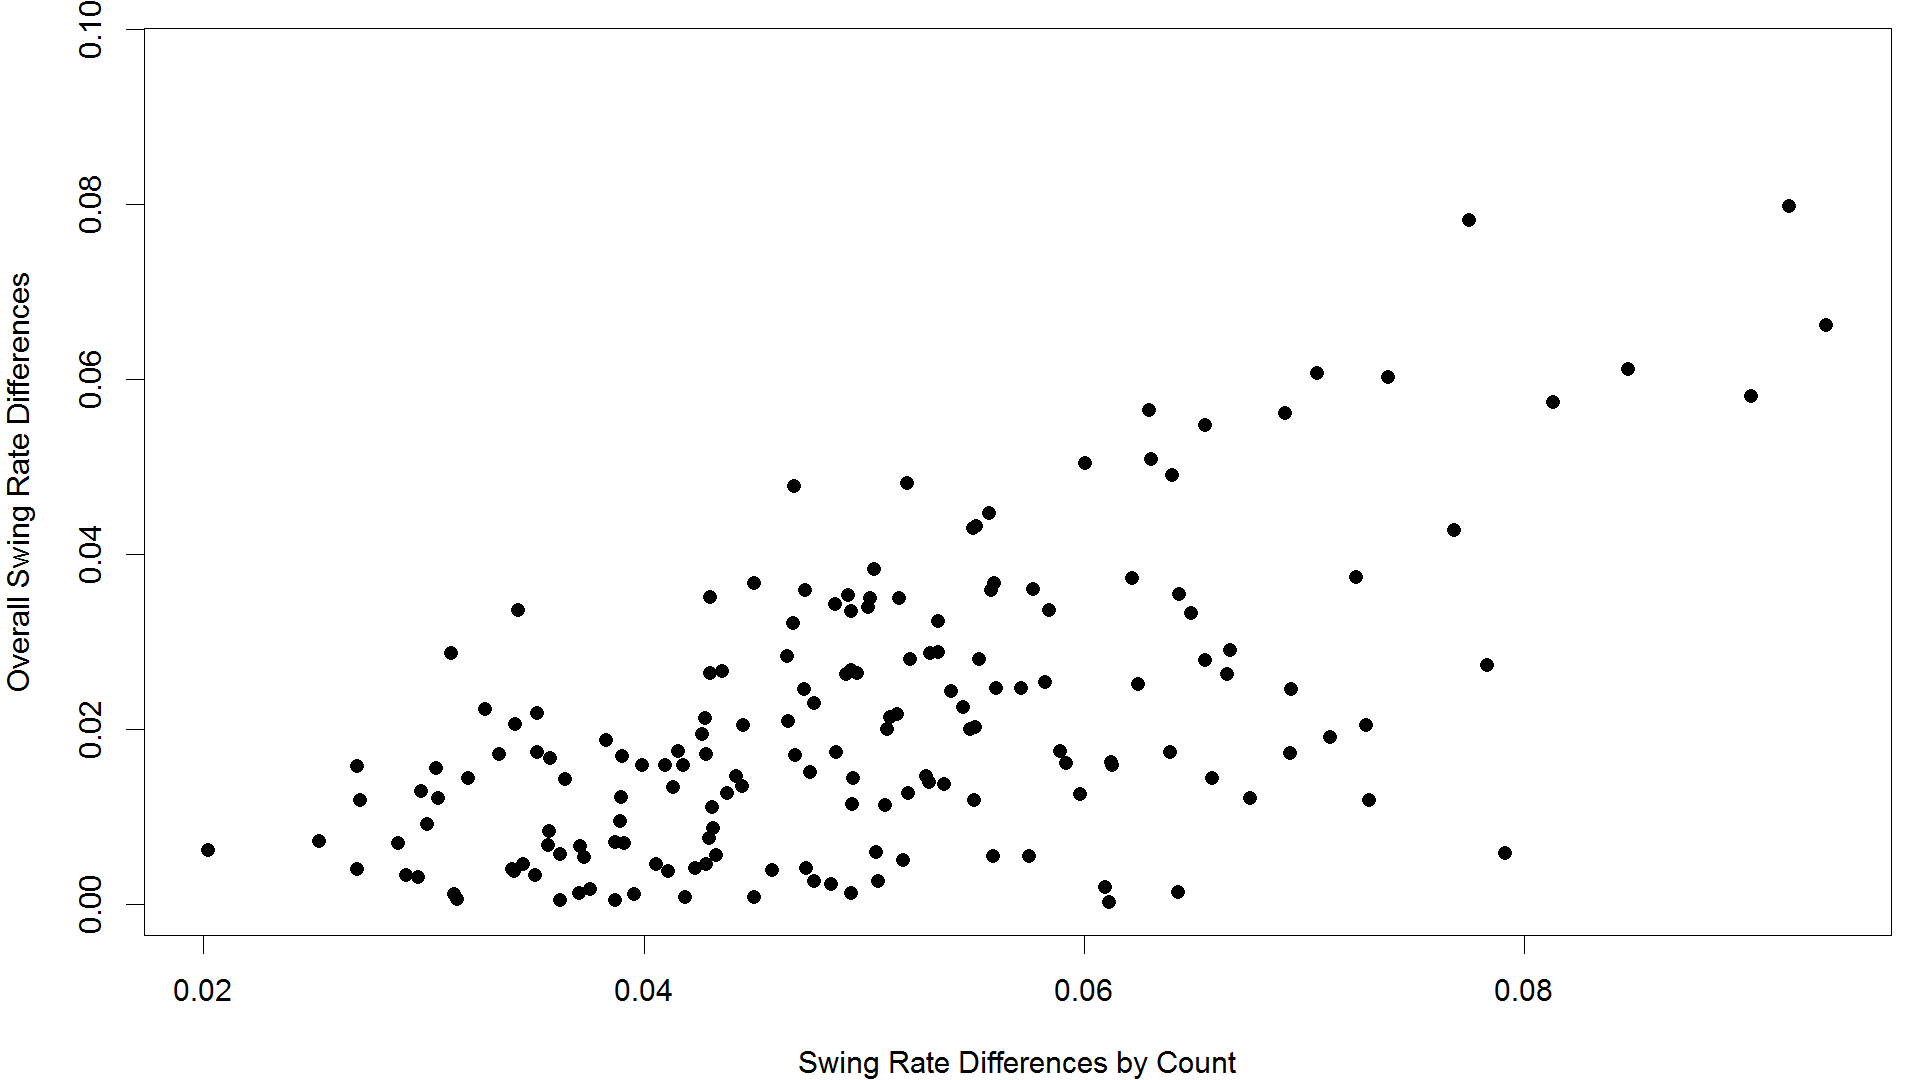
Graphed here is the count-adjusted swing rate difference between years (on the horizontal axis) vs. the overall swing rate difference (on the vertical axis). Almost always, the count-adjusted difference is a larger change. The overall correlation between the two metrics is only R2 = .36, which suggests that swing rates are a lot more dynamic than the plate discipline leaderboards would have you believe. There are some players with overall swing rates which changed less than 1 percentage point who have count-adjusted swing rates changing by 6+ percentage points. Those kind of differences indicate potentially significant changes in approach by count, which offset to produce small overall changes.
In closing, let’s take a brief look at which hitters have changed the most in terms of their count-adjusted swing rates. Here are the top 10 most significant changes.
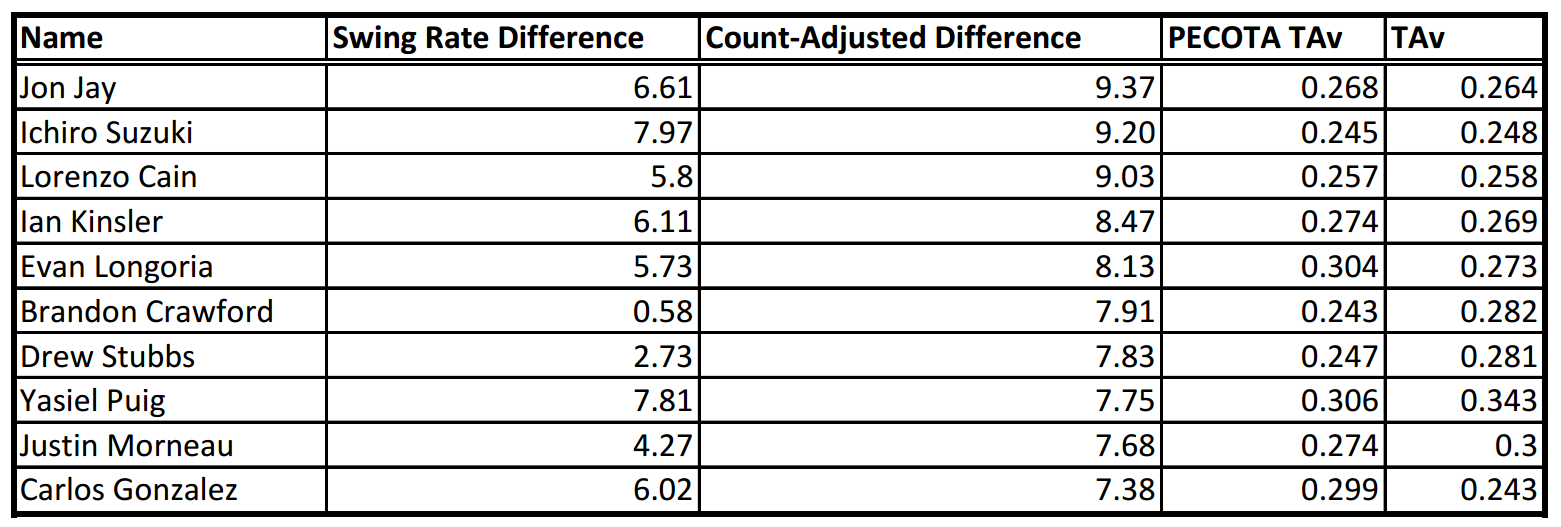
Most of the guys with the biggest count-adjusted differences in swing rates also had big changes in their overall swing rates. A couple of exceptions are Brandon Crawford and Justin Morneau. Both of these guys are dramatically outperforming their PECOTA projections. Crawford’s count-adjusted swing rates show a calculated pattern: he dropped his swing rates early in the count by nearly 10 percentage points, and raised them later in the count, in a kind of selective aggression. Morneau’s swing rate differences by count are all over the place, but he’s become overall more patient, perhaps contributing to his offensive resurgence.
As I mentioned, a lot of the top guys had changes in overall swing rate as well. What about players with little overall swing rate change, but large changes in count-specific swing rate?

Brandon Crawford tops the list. There are a few other interesting players, of both overperforming and underperforming varieties: Victor Martinez, who’s still knocking the cover off the ball, and Raul Ibanez, who’s (somehow) still employed. There’s no coherent identity to these hitters (insofar as I can figure). It would have been cool if changes in approach were also associated with more significant deviations from PECOTA’s forecasts, but that appears not to be the case (at least not in a statistically significant way).
As a side note, the list of guys with the lowest swing rate differences are overwhelmingly older players, mostly successful. Mike Trout tops the list of lowest swing rate changes; he’s not old, but I can imagine him keeping his approach intact year-to-year under the theory of “if it ain’t broke, don’t fix it.” Other guys like him include Jayson Werth, Marlon Byrd, and David Ortiz.
It’s easy to forget how significant the count is in determining the behavior of the batter. Taking it into account shows that swing rates are a lot more dynamic than the standard plate discipline statistics make them seem. Changes in approach are reasonably common, and swing rates can vary 5-10 percentage points regularly between years. However, a lot of that variation ends up evening out across counts, resulting in only small (1-5 percentage points) aggregated differences in swing rate. Whether all of this variation is meaningful at the level of individual players is still unresolved, and deserves a closer look.
Thank you for reading
This is a free article. If you enjoyed it, consider subscribing to Baseball Prospectus. Subscriptions support ongoing public baseball research and analysis in an increasingly proprietary environment.
Subscribe now
However, another reason they vary more is because of the offsetting changes that I talked about--hitter increases his rate on 0-0 counts, but decreases it almost as much on 0-1+1-0 counts, so the total change gets diminished.
Actually, come to think of it, I suppose I could have gotten the 'expected' amount that count-adjusted swing rates would vary by random sampling, and then compared that to the actual differences. For next time.
Thanks for the insight!
With no balls, you go from red to yellow (dark to light).
With 2 balls you go from light blue to dark blue (light to dark).
I like what you did with 2 balls, keeping the same general color and using a scale. But the consistency would help.
As I said, though, this is really interesting stuff.